## Line Chart: Accuracy vs. Thinking Compute
### Overview
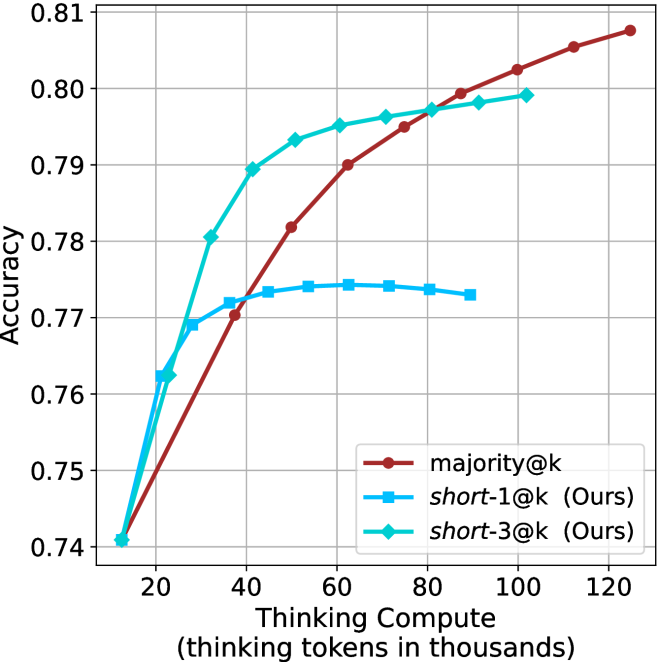
This chart illustrates the relationship between "Thinking Compute" (measured in thousands of thinking tokens) and model "Accuracy." It compares three different methods: a baseline method labeled `majority@k` and two methods labeled `short-1@k (Ours)` and `short-3@k (Ours)`. The chart demonstrates how accuracy scales as more computational resources are allocated to the thinking process.
### Components/Axes
* **Y-Axis (Vertical):** Labeled "Accuracy." The scale ranges from 0.74 to 0.81, with major grid lines at 0.01 intervals.
* **X-Axis (Horizontal):** Labeled "Thinking Compute (thinking tokens in thousands)." The scale ranges from 20 to 120, with major grid lines at 20-unit intervals.
* **Legend:** Located in the bottom-right quadrant of the chart.
* **`majority@k`**: Represented by a dark red line with circular markers.
* **`short-1@k (Ours)`**: Represented by a medium blue line with square markers.
* **`short-3@k (Ours)`**: Represented by a cyan (light blue) line with diamond markers.
### Detailed Analysis
All three data series originate from a common starting point at approximately (13, 0.741).
**1. `majority@k` (Dark Red, Circles)**
* **Trend:** This series exhibits a consistent, near-linear upward slope throughout the entire range. It does not show signs of plateauing within the visible chart area.
* **Data Points (Approximate):**
* Starts at ~13k tokens, 0.741 accuracy.
* At 38k tokens: ~0.770 accuracy.
* At 63k tokens: ~0.790 accuracy.
* At 88k tokens: ~0.799 accuracy.
* Ends at ~125k tokens: ~0.808 accuracy.
**2. `short-1@k (Ours)` (Medium Blue, Squares)**
* **Trend:** This series shows a rapid initial increase in accuracy, followed by a sharp plateau. After approximately 50k tokens, the accuracy gains become negligible, and the line begins to slightly decline after 75k tokens.
* **Data Points (Approximate):**
* Starts at ~13k tokens, 0.741 accuracy.
* At 25k tokens: ~0.769 accuracy.
* At 50k tokens: ~0.774 accuracy (Peak).
* Ends at ~90k tokens: ~0.773 accuracy.
**3. `short-3@k (Ours)` (Cyan, Diamonds)**
* **Trend:** This series shows the steepest initial growth, outperforming the other two methods in the 20k–80k token range. However, it exhibits diminishing returns, with the slope flattening significantly after 60k tokens.
* **Data Points (Approximate):**
* Starts at ~13k tokens, 0.741 accuracy.
* At 33k tokens: ~0.781 accuracy.
* At 53k tokens: ~0.793 accuracy.
* At 73k tokens: ~0.796 accuracy.
* Ends at ~103k tokens: ~0.799 accuracy.
### Key Observations
* **Efficiency vs. Capacity:** The "Ours" methods (`short-1@k` and `short-3@k`) are clearly optimized for lower compute budgets, achieving higher accuracy faster than `majority@k` in the early stages (under 40k tokens).
* **The Crossover Point:** `majority@k` overtakes `short-3@k` at approximately 85k tokens.
* **Performance Ceiling:** `short-1@k` hits a hard performance ceiling at ~0.774 accuracy, suggesting that adding more compute tokens beyond 50k provides no benefit for this specific method.
* **Scalability:** `majority@k` is the only method that demonstrates continued scalability, suggesting it is the superior choice if the compute budget is high (above 85k tokens).
### Interpretation
The data suggests a classic trade-off between "fast" optimization and "long-term" scaling. The methods labeled "(Ours)" appear to be designed for efficiency, allowing the model to reach a respectable accuracy level with fewer tokens. However, they suffer from diminishing returns, likely due to the specific constraints or architecture of those methods.
Conversely, `majority@k` acts as a baseline that scales reliably with increased compute. The chart implies that if a user has a limited compute budget (e.g., < 80k tokens), `short-3@k` is the optimal choice. If the user has a high compute budget (e.g., > 90k tokens), `majority@k` is the superior choice, as it continues to improve while the other methods plateau or decline.