## Scatter Plot: Accuracy vs. Time-to-Answer
### Overview
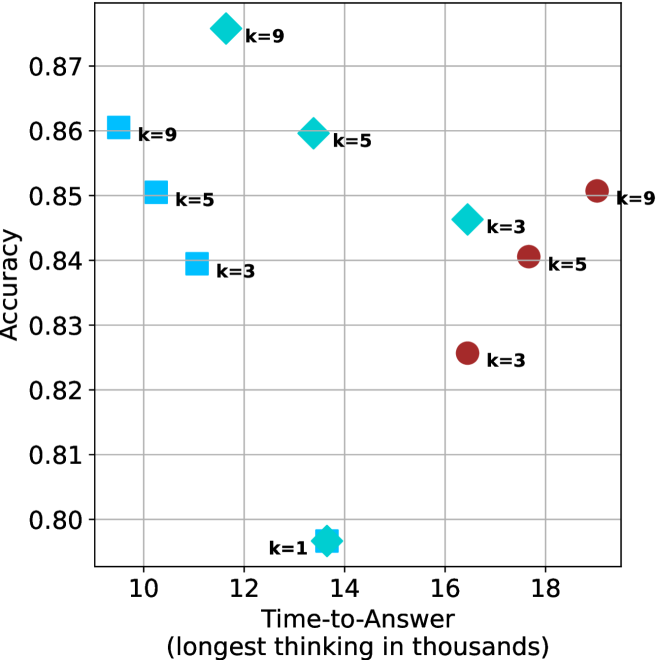
The image is a scatter plot showing the relationship between "Accuracy" and "Time-to-Answer" for different values of 'k'. The plot contains data points represented by different shapes and colors, each labeled with a 'k' value.
### Components/Axes
* **X-axis:** "Time-to-Answer (longest thinking in thousands)". The axis ranges from approximately 9 to 19, with gridlines at integer values.
* **Y-axis:** "Accuracy". The axis ranges from 0.80 to 0.87, with gridlines at intervals of 0.01.
* **Data Points:**
* Light Blue Squares: k=9, k=5, k=3
* Light Blue Diamonds: k=9, k=5, k=3
* Light Blue Octagon: k=1
* Dark Red Circles: k=9, k=5, k=3
* **Labels:** Each data point is labeled with its corresponding 'k' value.
### Detailed Analysis
Here's a breakdown of the data points:
* **Light Blue Squares:**
* k=9: Accuracy ~0.86, Time-to-Answer ~10
* k=5: Accuracy ~0.85, Time-to-Answer ~11
* k=3: Accuracy ~0.84, Time-to-Answer ~12
* **Light Blue Diamonds:**
* k=9: Accuracy ~0.875, Time-to-Answer ~12
* k=5: Accuracy ~0.86, Time-to-Answer ~14
* k=3: Accuracy ~0.845, Time-to-Answer ~16
* **Light Blue Octagon:**
* k=1: Accuracy ~0.795, Time-to-Answer ~13.5
* **Dark Red Circles:**
* k=9: Accuracy ~0.85, Time-to-Answer ~18.5
* k=5: Accuracy ~0.84, Time-to-Answer ~17.5
* k=3: Accuracy ~0.825, Time-to-Answer ~16.5
### Key Observations
* Accuracy generally decreases as Time-to-Answer increases for each shape.
* The light blue squares have the lowest Time-to-Answer values.
* The dark red circles have the highest Time-to-Answer values.
* The light blue octagon (k=1) has the lowest accuracy and a moderate Time-to-Answer.
### Interpretation
The scatter plot visualizes the trade-off between accuracy and time-to-answer for different values of 'k'. The data suggests that increasing 'k' (represented by the light blue squares, diamonds, and dark red circles) generally leads to a decrease in accuracy and an increase in time-to-answer. The light blue octagon (k=1) represents a scenario with low accuracy and a moderate time-to-answer, suggesting that a very low 'k' value might not be optimal. The plot indicates that there is a relationship between the parameter 'k', the time taken to answer, and the accuracy of the answers.