## Scatter Plot: Accuracy vs. Time-to-Answer
### Overview
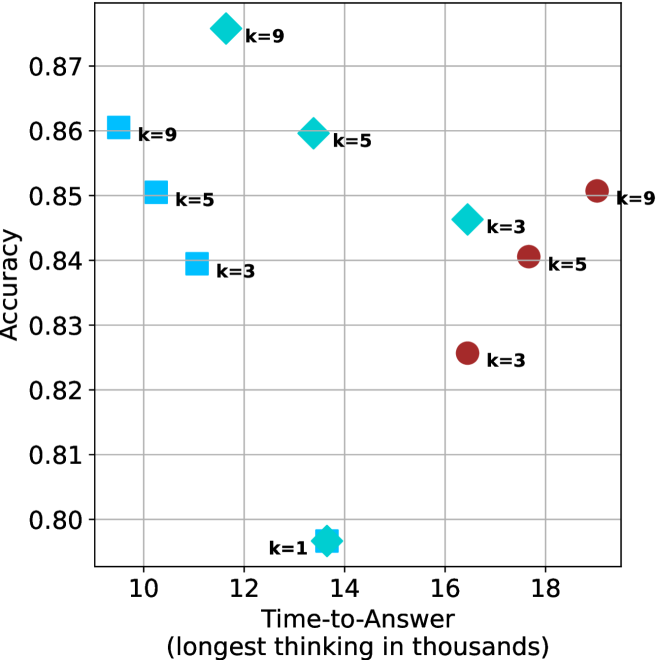
This image is a scatter plot visualizing the relationship between "Time-to-Answer" (measured in thousands of units, likely representing thinking time) and "Accuracy" for various model configurations. The data points are categorized by shape and color, with each point labeled by a "k" value (likely representing a hyperparameter like k-nearest neighbors or a similar variable).
### Components/Axes
* **Y-Axis (Vertical):** Labeled "Accuracy". The scale ranges from 0.80 to 0.87, with grid lines at 0.01 intervals.
* **X-Axis (Horizontal):** Labeled "Time-to-Answer (longest thinking in thousands)". The scale ranges from 10 to 18, with grid lines at intervals of 2.
* **Data Series (Markers):**
* **Light Blue Squares:** Three points (k=3, k=5, k=9).
* **Cyan Diamonds:** Three points (k=3, k=5, k=9).
* **Maroon Circles:** Three points (k=3, k=5, k=9).
* **Cyan Star/Asterisk:** One point (k=1).
### Detailed Analysis
The data points are grouped by shape. Below are the approximate coordinates (X, Y) for each point:
**1. Light Blue Squares (Fastest Group)**
*Trend: As k increases, accuracy increases, and time-to-answer increases slightly.*
* **k=3:** Located at X ≈ 11.2, Y ≈ 0.840.
* **k=5:** Located at X ≈ 10.8, Y ≈ 0.851.
* **k=9:** Located at X ≈ 10.2, Y ≈ 0.861.
**2. Cyan Diamonds (High Accuracy Group)**
*Trend: As k increases, accuracy increases, but time-to-answer decreases (inverse relationship).*
* **k=3:** Located at X ≈ 16.4, Y ≈ 0.846.
* **k=5:** Located at X ≈ 13.8, Y ≈ 0.860.
* **k=9:** Located at X ≈ 11.6, Y ≈ 0.876.
**3. Maroon Circles (Slowest Group)**
*Trend: As k increases, accuracy increases, and time-to-answer increases significantly.*
* **k=3:** Located at X ≈ 16.4, Y ≈ 0.826.
* **k=5:** Located at X ≈ 17.7, Y ≈ 0.841.
* **k=9:** Located at X ≈ 19.0, Y ≈ 0.851.
**4. Cyan Star (Outlier)**
* **k=1:** Located at X ≈ 13.8, Y ≈ 0.797. This is the lowest accuracy point on the chart.
### Key Observations
* **Performance Ceiling:** The highest accuracy achieved is approximately 0.876 (Cyan Diamond, k=9).
* **Performance Floor:** The lowest accuracy is approximately 0.797 (Cyan Star, k=1).
* **Clustering:** The data forms three distinct "paths" or clusters based on the marker shape. The Maroon Circles are consistently the slowest (highest time-to-answer), while the Light Blue Squares are the fastest.
* **Parameter Consistency:** Across all three main groups (Squares, Diamonds, Circles), increasing the "k" value consistently results in higher accuracy.
### Interpretation
The data demonstrates a clear trade-off between computational time and model accuracy, but this trade-off is highly dependent on the underlying model architecture (represented by the marker shapes).
* **The "k" Factor:** The parameter "k" acts as a positive driver for accuracy across all tested configurations. Higher "k" values consistently yield better accuracy, though they often come at the cost of increased time-to-answer (except in the case of the Cyan Diamonds, where higher "k" actually correlates with faster times).
* **Architectural Efficiency:** The Light Blue Squares represent the most efficient architecture, achieving high accuracy (up to 0.861) with the lowest time-to-answer (10-11k). Conversely, the Maroon Circles represent a less efficient architecture, requiring significantly more time (16-19k) to achieve similar or lower accuracy levels compared to the other groups.
* **Anomaly:** The k=1 configuration (Cyan Star) is a significant outlier, performing poorly in accuracy despite requiring a moderate amount of time (13.8k). This suggests that k=1 is likely an under-optimized or unstable configuration for this specific task.