## Line Chart: Accuracy vs. Attack Ratio
### Overview
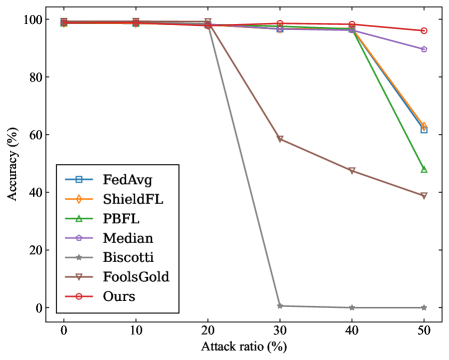
The image is a line chart comparing the accuracy of different federated learning methods against varying attack ratios. The chart displays how the accuracy of each method changes as the attack ratio increases from 0% to 50%. The methods compared are FedAvg, ShieldFL, PBFL, Median, Biscotti, FoolsGold, and Ours.
### Components/Axes
* **X-axis:** Attack ratio (%), with markers at 0, 10, 20, 30, 40, and 50.
* **Y-axis:** Accuracy (%), with markers at 0, 20, 40, 60, 80, and 100.
* **Legend:** Located on the left side of the chart, listing the methods and their corresponding line colors and markers:
* FedAvg (blue, square marker)
* ShieldFL (orange, diamond marker)
* PBFL (green, triangle marker)
* Median (purple, pentagon marker)
* Biscotti (gray, star marker)
* FoolsGold (brown, inverted triangle marker)
* Ours (red, circle marker)
### Detailed Analysis
* **FedAvg (blue, square):** The accuracy remains relatively stable around 98% - 99% until an attack ratio of 40%, after which it drops to approximately 62% at 50%.
* (0, 99)
* (10, 99)
* (20, 98)
* (30, 98)
* (40, 98)
* (50, 62)
* **ShieldFL (orange, diamond):** Similar to FedAvg, the accuracy is stable around 98% - 99% until an attack ratio of 40%, then drops to approximately 62% at 50%.
* (0, 99)
* (10, 99)
* (20, 98)
* (30, 98)
* (40, 98)
* (50, 62)
* **PBFL (green, triangle):** The accuracy is stable around 98% - 99% until an attack ratio of 40%, then drops significantly to approximately 48% at 50%.
* (0, 99)
* (10, 99)
* (20, 98)
* (30, 97)
* (40, 98)
* (50, 48)
* **Median (purple, pentagon):** The accuracy is stable around 98% - 99% until an attack ratio of 40%, then drops to approximately 90% at 50%.
* (0, 99)
* (10, 99)
* (20, 98)
* (30, 97)
* (40, 98)
* (50, 90)
* **Biscotti (gray, star):** The accuracy drops sharply from approximately 99% at 20% attack ratio to nearly 0% at 30% attack ratio, remaining near 0% for higher attack ratios.
* (0, 99)
* (10, 99)
* (20, 99)
* (30, 1)
* (40, 0)
* (50, 0)
* **FoolsGold (brown, inverted triangle):** The accuracy gradually decreases from approximately 99% at 0% attack ratio to approximately 40% at 50% attack ratio.
* (0, 99)
* (10, 98)
* (20, 98)
* (30, 59)
* (40, 48)
* (50, 40)
* **Ours (red, circle):** The accuracy remains stable around 98% - 99% across all attack ratios.
* (0, 99)
* (10, 99)
* (20, 99)
* (30, 98)
* (40, 98)
* (50, 97)
### Key Observations
* The "Ours" method (red line) demonstrates the most resilience to increasing attack ratios, maintaining a consistently high accuracy.
* Biscotti (gray line) is highly susceptible to attacks, with its accuracy plummeting to near zero at a 30% attack ratio.
* FedAvg, ShieldFL, and PBFL show similar performance, maintaining high accuracy until a 40% attack ratio, after which their accuracy drops.
* FoolsGold experiences a gradual decline in accuracy as the attack ratio increases.
* Median maintains a high accuracy even at a 50% attack ratio.
### Interpretation
The chart illustrates the vulnerability of different federated learning methods to adversarial attacks. The "Ours" method appears to be the most robust against such attacks, maintaining a high level of accuracy even with a high attack ratio. Biscotti is the most vulnerable, while FedAvg, ShieldFL, and PBFL show moderate vulnerability. The performance of Median and FoolsGold falls in between. This suggests that the "Ours" method incorporates mechanisms to mitigate the impact of malicious actors, making it a potentially more reliable choice in environments where adversarial attacks are a concern. The data highlights the importance of considering the robustness of federated learning methods when deploying them in real-world scenarios.