\n
## Diagram: Prover Policy and Performance Analysis
### Overview
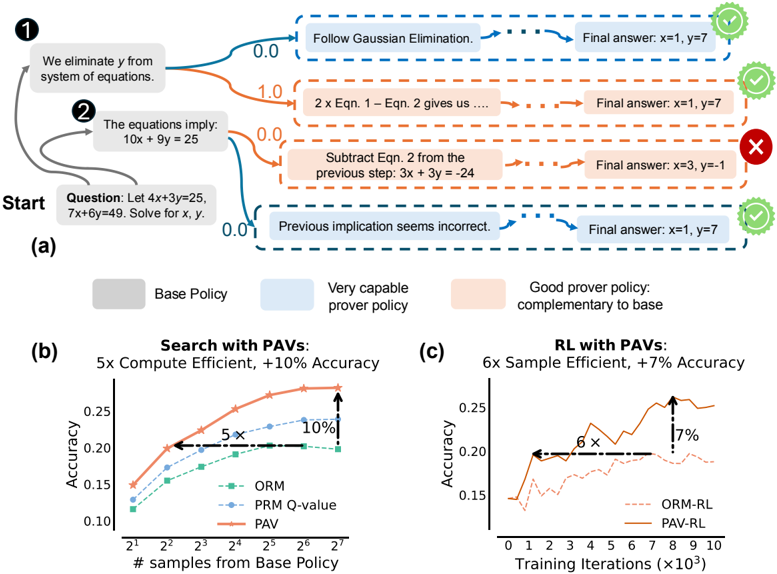
The image presents a diagram illustrating a system for solving equations, comparing a "Base Policy" to a "Very capable prover policy" and evaluating their performance using Proof-Aware Values (PAVs). The diagram shows a sequence of steps in solving an equation, with feedback on the correctness of each step. Below this, two charts (b and c) compare the performance of different policies using metrics like accuracy and efficiency.
### Components/Axes
The diagram consists of three main sections: (a) a flow diagram of the equation-solving process, (b) a chart comparing "Search with PAVs" performance, and (c) a chart comparing "RL with PAVs" performance.
**Section (a):**
* **Start:** Indicates the beginning of the problem.
* **Question:** "Let 4x+3y=25, 7x+6y=49. Solve for x, y."
* **Step 1:** "We eliminate y from system of equations." (Associated with a blue curved line)
* **Step 2:** "The equations imply: 10x + 9y = 25" (Associated with an orange curved line)
* **Feedback:** Green checkmarks indicate correct steps, red crosses indicate incorrect steps.
* **Final Answer:** Displayed alongside each step, showing the system's solution attempt.
* **Policy Blocks:** "Base Policy" (grey), "Very capable prover policy" (light blue), "Good prover policy: complementary to base" (dark blue).
**Section (b): Search with PAVs**
* **X-axis:** "# samples from Base Policy" (Scale: 2<sup>1</sup> to 2<sup>7</sup>)
* **Y-axis:** "Accuracy" (Scale: 0.10 to 0.25)
* **Legend:**
* "ORM" (Solid Red Line)
* "PRM Q-value" (Dashed Orange Line)
* "PAV" (Dashed Teal Line)
* **Annotations:** "5x Compute Efficient", "10% Accuracy"
**Section (c): RL with PAVs**
* **X-axis:** "Training Iterations (x10<sup>3</sup>)" (Scale: 0 to 10)
* **Y-axis:** "Accuracy" (Scale: 0.10 to 0.25)
* **Legend:**
* "ORM-RL" (Solid Red Line)
* "PAV-RL" (Dashed Teal Line)
* **Annotations:** "6x Sample Efficient", "7% Accuracy"
### Detailed Analysis or Content Details
**Section (a):**
The flow diagram shows the system attempting to solve the given equations.
* Step 1: The system attempts to eliminate 'y', resulting in a final answer of x=1, y=7 (Correct).
* Step 2: The system attempts to derive the next equation, resulting in a final answer of x=1, y=7 (Correct).
* A third attempt (not numbered) leads to an incorrect implication and a final answer of x=-1, y=3 (Incorrect).
* A fourth attempt (not numbered) leads to a final answer of x=1, y=7 (Correct).
**Section (b): Search with PAVs**
* **ORM:** Starts at approximately 0.12 accuracy at 2<sup>1</sup> samples, rises to approximately 0.22 accuracy at 2<sup>7</sup> samples. The line slopes upward, with increasing steepness.
* **PRM Q-value:** Starts at approximately 0.11 accuracy at 2<sup>1</sup> samples, rises to approximately 0.18 accuracy at 2<sup>7</sup> samples. The line slopes upward, but less steeply than ORM.
* **PAV:** Starts at approximately 0.10 accuracy at 2<sup>1</sup> samples, rises to approximately 0.20 accuracy at 2<sup>7</sup> samples. The line slopes upward, with a moderate steepness.
**Section (c): RL with PAVs**
* **ORM-RL:** Starts at approximately 0.12 accuracy at 0 training iterations, rises to approximately 0.23 accuracy at 9x10<sup>3</sup> training iterations. The line initially rises steeply, then plateaus.
* **PAV-RL:** Starts at approximately 0.11 accuracy at 0 training iterations, rises to approximately 0.24 accuracy at 9x10<sup>3</sup> training iterations. The line rises more consistently than ORM-RL, with a slight peak around 8x10<sup>3</sup> iterations.
### Key Observations
* In Section (b), PAV consistently outperforms PRM Q-value, and achieves comparable accuracy to ORM with fewer samples.
* In Section (c), PAV-RL consistently outperforms ORM-RL in terms of accuracy.
* The annotations highlight that using PAVs results in 5x compute efficiency and 10% accuracy improvement in the search process (Section b), and 6x sample efficiency and 7% accuracy improvement in the RL process (Section c).
* The system demonstrates an ability to recover from incorrect implications (as seen in the red 'X' step in Section a).
### Interpretation
The diagram demonstrates the effectiveness of using Proof-Aware Values (PAVs) to improve the performance of both search and reinforcement learning algorithms in the context of equation solving. PAVs enhance both accuracy and efficiency. The flow diagram in Section (a) illustrates the iterative nature of the problem-solving process and the system's ability to learn from its mistakes. The comparison between the "Base Policy" and the "Very capable prover policy" suggests that incorporating proof-awareness leads to a more robust and accurate solver. The annotations quantify these improvements, providing concrete evidence of the benefits of using PAVs. The consistent outperformance of PAV-based methods in both charts suggests a generalizable advantage, applicable to a range of problem-solving scenarios. The slight peak in the PAV-RL curve around 8x10<sup>3</sup> iterations might indicate an optimal training point beyond which further iterations yield diminishing returns.