## Line Charts: Performance Comparison of Language Models
### Overview
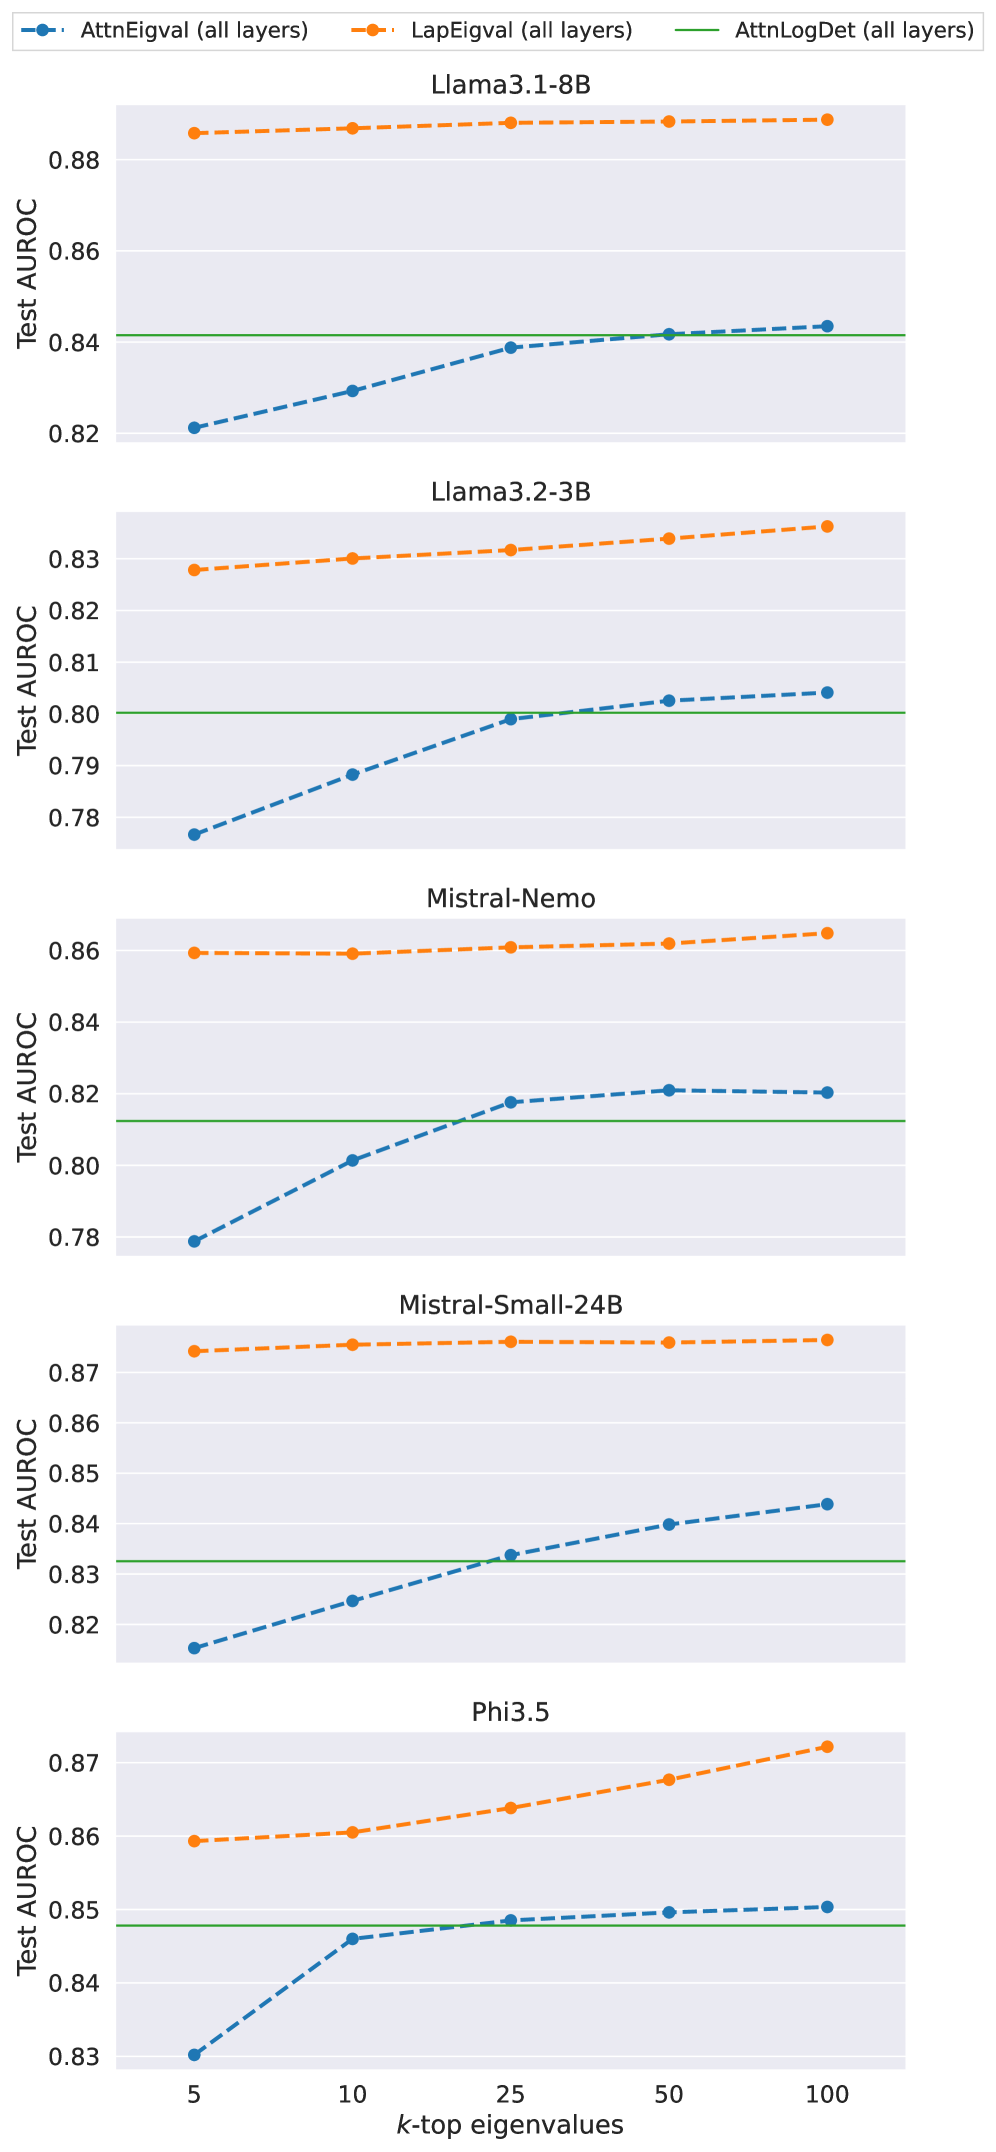
The image presents a series of line charts comparing the performance of different language models using various eigenvalue-based metrics. Each chart corresponds to a specific language model (Llama3.1-8B, Llama3.2-3B, Mistral-Nemo, Mistral-Small-24B, and Phi3.5). The x-axis represents the number of top eigenvalues considered (k-top eigenvalues), and the y-axis represents the Test AUROC (Area Under the Receiver Operating Characteristic curve), a measure of model performance. Three different methods are compared: AttnEigval (all layers), LapEigval (all layers), and AttnLogDet (all layers).
### Components/Axes
* **Title:** Each chart has a title indicating the language model being evaluated (e.g., "Llama3.1-8B").
* **X-axis:** Labeled "k-top eigenvalues" with values 5, 10, 25, 50, and 100.
* **Y-axis:** Labeled "Test AUROC" with a scale ranging from approximately 0.78 to 0.88, with increments of 0.02.
* **Legend:** Located at the top of the image, the legend identifies the three methods:
* **Blue:** AttnEigval (all layers)
* **Orange:** LapEigval (all layers)
* **Green:** AttnLogDet (all layers)
### Detailed Analysis
**Chart 1: Llama3.1-8B**
* **AttnEigval (all layers) (Blue):** The line starts at approximately 0.82 for k=5 and increases to approximately 0.84 for k=25, then plateaus around 0.842 at k=100.
* **LapEigval (all layers) (Orange):** The line is relatively flat, starting at approximately 0.885 and remaining nearly constant across all k values.
* **AttnLogDet (all layers) (Green):** The line is a constant horizontal line at approximately 0.84.
**Chart 2: Llama3.2-3B**
* **AttnEigval (all layers) (Blue):** The line starts at approximately 0.78 and increases to approximately 0.802 at k=100.
* **LapEigval (all layers) (Orange):** The line starts at approximately 0.828 and increases to approximately 0.835 at k=100.
* **AttnLogDet (all layers) (Green):** The line is a constant horizontal line at approximately 0.80.
**Chart 3: Mistral-Nemo**
* **AttnEigval (all layers) (Blue):** The line starts at approximately 0.78 and increases to approximately 0.822 at k=100.
* **LapEigval (all layers) (Orange):** The line is relatively flat, starting at approximately 0.86 and remaining nearly constant across all k values.
* **AttnLogDet (all layers) (Green):** The line is a constant horizontal line at approximately 0.812.
**Chart 4: Mistral-Small-24B**
* **AttnEigval (all layers) (Blue):** The line starts at approximately 0.817 and increases to approximately 0.845 at k=100.
* **LapEigval (all layers) (Orange):** The line is relatively flat, starting at approximately 0.872 and remaining nearly constant across all k values.
* **AttnLogDet (all layers) (Green):** The line is a constant horizontal line at approximately 0.832.
**Chart 5: Phi3.5**
* **AttnEigval (all layers) (Blue):** The line starts at approximately 0.83 and increases to approximately 0.85 at k=100.
* **LapEigval (all layers) (Orange):** The line starts at approximately 0.859 and increases to approximately 0.87 at k=100.
* **AttnLogDet (all layers) (Green):** The line is a constant horizontal line at approximately 0.848.
### Key Observations
* **LapEigval (all layers) (Orange):** Generally shows the highest Test AUROC scores across all models and remains relatively stable as the number of eigenvalues increases.
* **AttnEigval (all layers) (Blue):** Shows an increasing trend in Test AUROC as the number of eigenvalues increases for all models.
* **AttnLogDet (all layers) (Green):** Provides a constant baseline for each model, independent of the number of eigenvalues considered.
* The performance difference between AttnEigval and LapEigval varies across different models.
### Interpretation
The charts compare the performance of different language models using eigenvalue-based methods. The LapEigval method consistently achieves high AUROC scores, suggesting it is a robust performance indicator across different models. The AttnEigval method shows improvement with more eigenvalues, indicating that considering more components can enhance performance. The AttnLogDet method provides a stable baseline, allowing for comparison of the other two methods' relative performance. The varying performance of AttnEigval across models suggests that its effectiveness is model-dependent. The data suggests that LapEigval is a more reliable metric for these models, while AttnEigval can be optimized by tuning the number of eigenvalues considered.