\n
## Line Chart: Test AUROC vs. k-top eigenvalues
### Overview
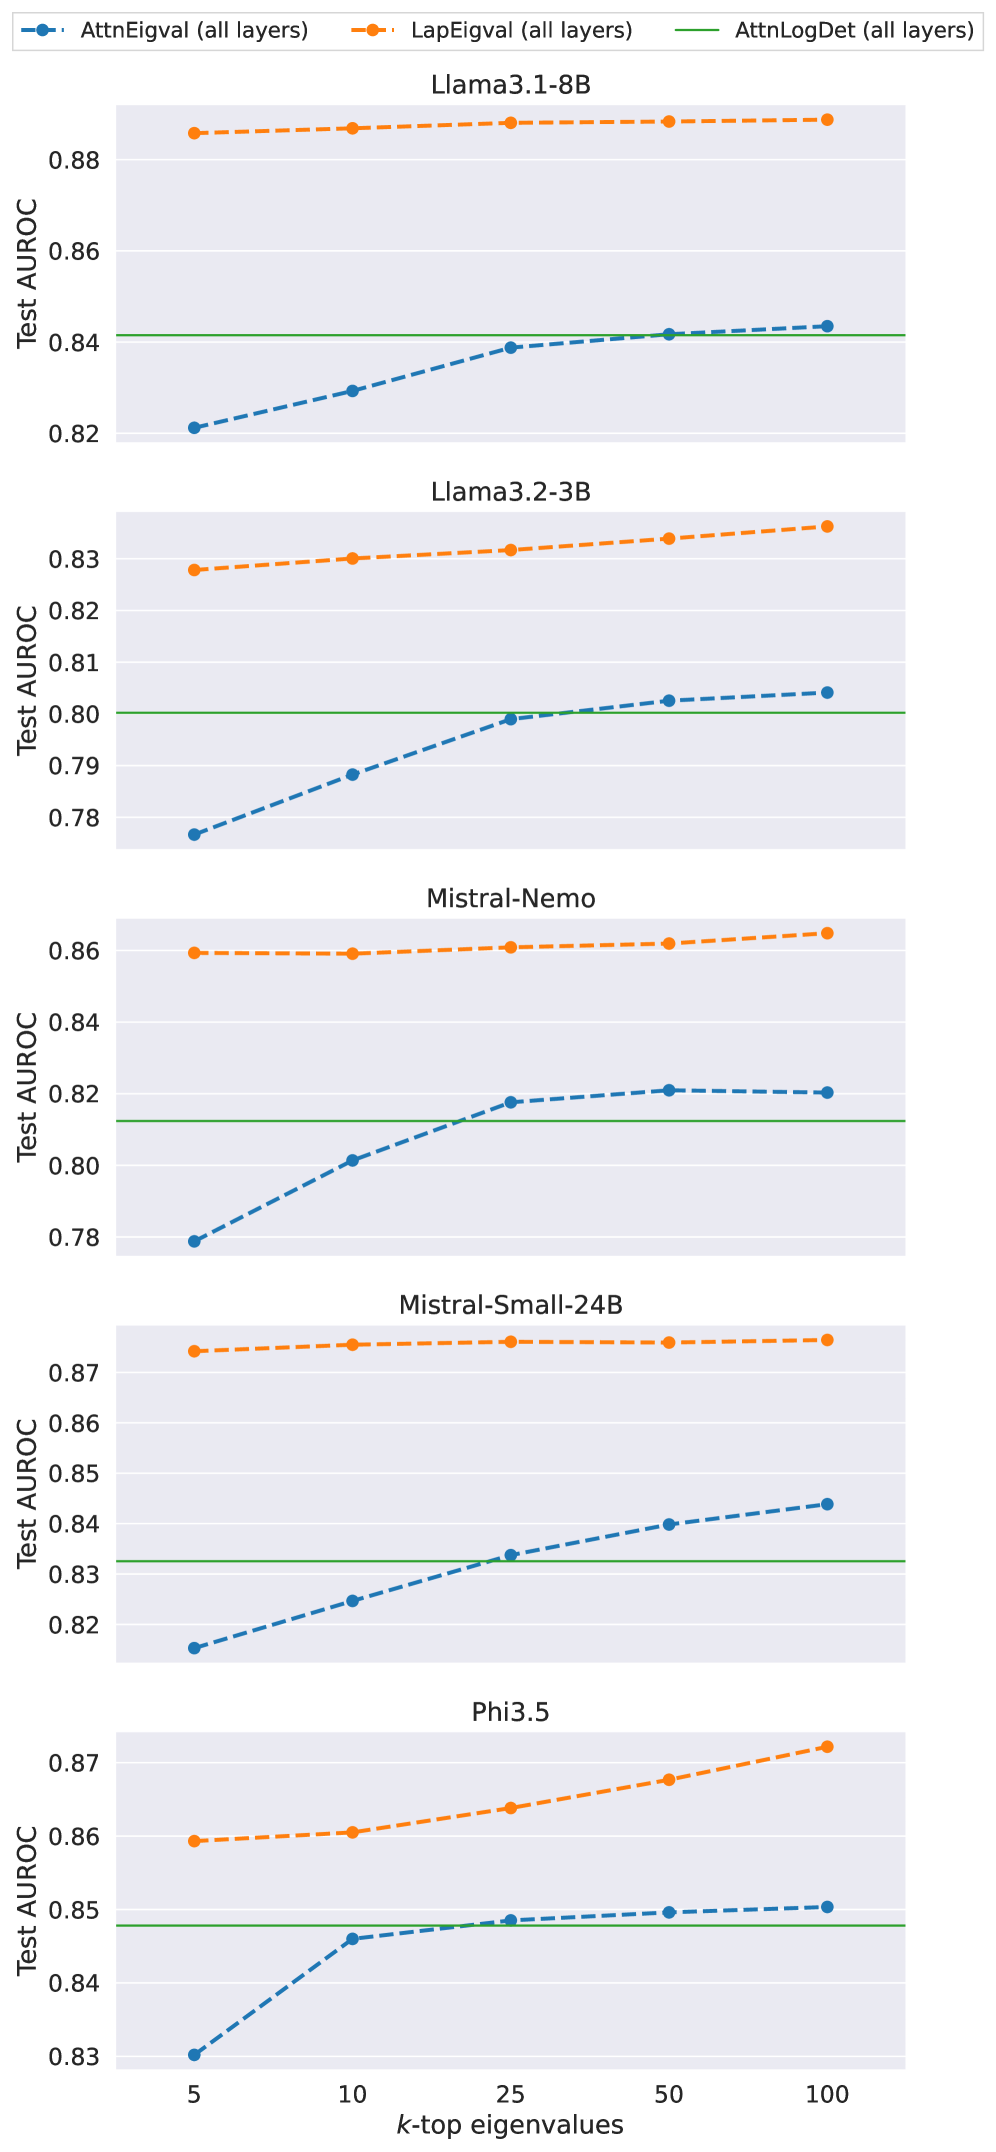
This image presents a line chart comparing the Test AUROC (Area Under the Receiver Operating Characteristic curve) scores for five different language models (Llama3.1-8B, Llama3.2-3B, Mistral-Nemo, Mistral-Small-24B, and Phi3.5) across varying numbers of k-top eigenvalues (5, 10, 25, 50, and 100). Three different metrics – AttnEigval, LapEigval, and AttnLogDet – are used to calculate the AUROC scores for each model.
### Components/Axes
* **X-axis:** k-top eigenvalues (Scale: 5, 10, 25, 50, 100)
* **Y-axis:** Test AUROC (Scale: 0.78 to 0.88)
* **Legend:** Located at the top-right corner of the chart.
* AttnEigval (all layers) - Blue dashed line with circle markers
* LapEigval (all layers) - Orange dashed line with circle markers
* AttnLogDet (all layers) - Green dashed line with circle markers
* **Models:** Llama3.1-8B, Llama3.2-3B, Mistral-Nemo, Mistral-Small-24B, Phi3.5. Each model is represented by a separate row of data.
### Detailed Analysis
The chart consists of five sub-charts, one for each model. Each sub-chart displays the Test AUROC scores for the three metrics as a function of the number of k-top eigenvalues.
**Llama3.1-8B:**
* AttnEigval: Starts at approximately 0.835 at k=5, remains relatively stable around 0.84-0.85, and slightly increases to approximately 0.85 at k=100.
* LapEigval: Starts at approximately 0.86 at k=5, remains relatively stable around 0.85-0.86, and slightly decreases to approximately 0.85 at k=100.
* AttnLogDet: Remains relatively constant at approximately 0.84 across all k-top eigenvalue values.
**Llama3.2-3B:**
* AttnEigval: Starts at approximately 0.795 at k=5, increases to approximately 0.81 at k=25, and then slightly decreases to approximately 0.805 at k=100.
* LapEigval: Starts at approximately 0.825 at k=5, remains relatively stable around 0.82-0.83, and slightly decreases to approximately 0.82 at k=100.
* AttnLogDet: Remains relatively constant at approximately 0.81 across all k-top eigenvalue values.
**Mistral-Nemo:**
* AttnEigval: Starts at approximately 0.79 at k=5, increases to approximately 0.82 at k=50, and then slightly decreases to approximately 0.81 at k=100.
* LapEigval: Starts at approximately 0.85 at k=5, remains relatively stable around 0.84-0.85, and slightly decreases to approximately 0.84 at k=100.
* AttnLogDet: Remains relatively constant at approximately 0.83 across all k-top eigenvalue values.
**Mistral-Small-24B:**
* AttnEigval: Starts at approximately 0.83 at k=5, increases to approximately 0.85 at k=50, and then slightly decreases to approximately 0.84 at k=100.
* LapEigval: Starts at approximately 0.86 at k=5, remains relatively stable around 0.86-0.87, and slightly decreases to approximately 0.86 at k=100.
* AttnLogDet: Remains relatively constant at approximately 0.84 across all k-top eigenvalue values.
**Phi3.5:**
* AttnEigval: Starts at approximately 0.845 at k=5, increases to approximately 0.855 at k=25, and then remains relatively stable around 0.85 at k=50 and k=100.
* LapEigval: Starts at approximately 0.865 at k=5, remains relatively stable around 0.86-0.87, and slightly decreases to approximately 0.86 at k=100.
* AttnLogDet: Remains relatively constant at approximately 0.85 across all k-top eigenvalue values.
### Key Observations
* LapEigval generally yields the highest AUROC scores across all models and k-top eigenvalue values.
* AttnLogDet consistently shows the most stable AUROC scores, with minimal variation across different k-top eigenvalue values.
* AttnEigval shows the most variation in AUROC scores, particularly for Llama3.2-3B and Mistral-Nemo, where the scores increase significantly between k=5 and k=25.
* The impact of increasing k-top eigenvalues on AUROC scores appears to diminish as k increases beyond 25 for most models and metrics.
### Interpretation
The chart demonstrates the performance of different language models using three different eigenvalue-based metrics. The consistent high performance of LapEigval suggests that Laplacian eigenvalues are a robust indicator of model quality. The stability of AttnLogDet indicates that the logarithm of the attention determinant is less sensitive to the number of eigenvalues considered. The varying performance of AttnEigval suggests that attention eigenvalues may be more sensitive to specific model architectures or training data.
The diminishing returns of increasing k-top eigenvalues beyond 25 suggest that a limited number of eigenvalues capture most of the relevant information for evaluating model performance. This could be useful for reducing computational costs and simplifying the evaluation process.
The differences in performance between the models highlight the varying strengths and weaknesses of different language model architectures. Llama3.1-8B and Mistral-Small-24B consistently show higher AUROC scores than Llama3.2-3B and Mistral-Nemo, suggesting that larger models or different architectures may be more effective at capturing relevant information. Phi3.5 shows a moderate performance, generally falling between the two groups.