## Line Chart Series: Model Performance vs. Eigenvalue Count
### Overview
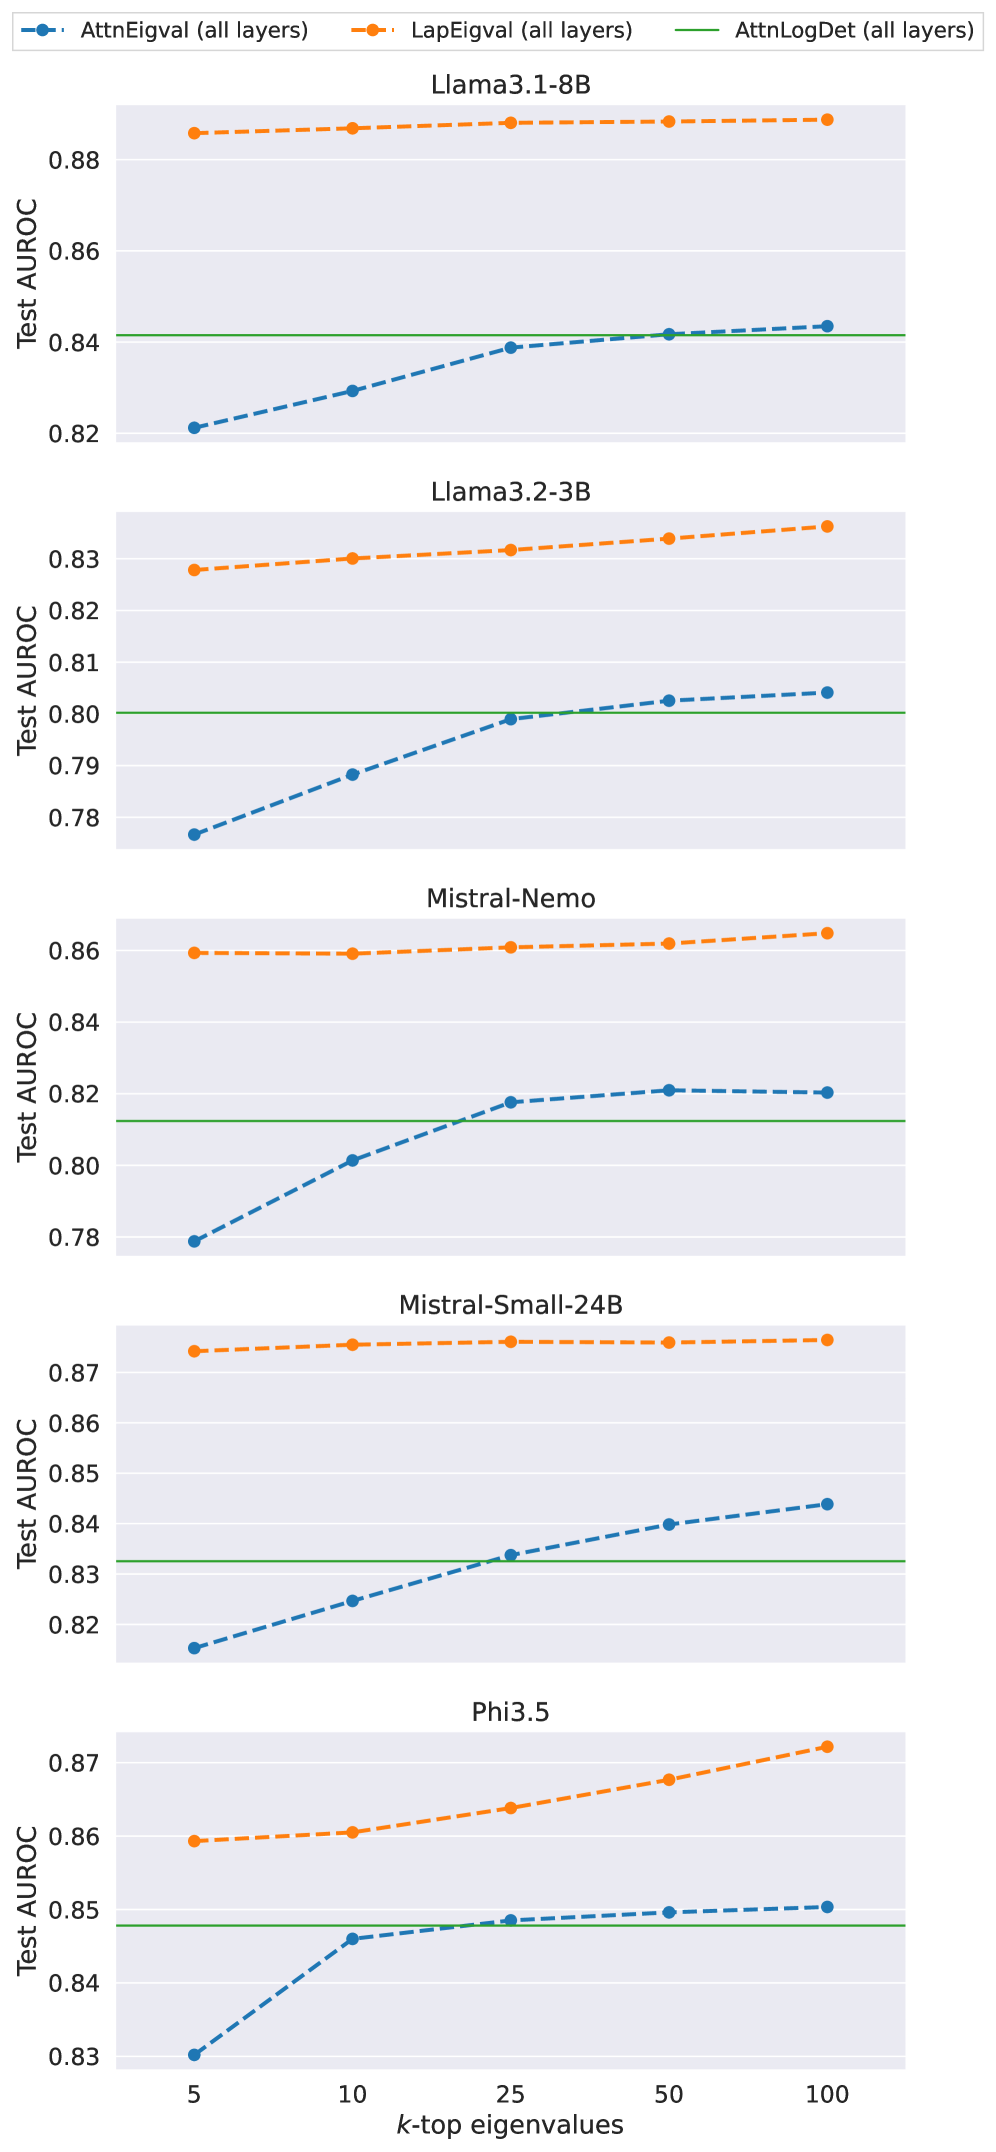
The image displays a series of five vertically stacked line charts. Each chart compares the performance (Test AUROC) of three different metrics as a function of the number of top eigenvalues (`k`) considered. The analysis is performed across five distinct language models.
### Components/Axes
* **Legend:** Located at the top center of the entire figure.
* **Blue dashed line with circle markers:** `AttnEigval (all layers)`
* **Orange dashed line with circle markers:** `LapEigval (all layers)`
* **Green solid line:** `AttnLogDet (all layers)`
* **X-Axis (Common to all subplots):** Label: `k-top eigenvalues`. Ticks and values: `5`, `10`, `25`, `50`, `100`.
* **Y-Axis (Per subplot):** Label: `Test AUROC`. The scale varies per subplot to best fit the data.
* **Subplot Titles (Top to Bottom):**
1. `Llama3.1-8B`
2. `Llama3.2-3B`
3. `Mistral-Nemo`
4. `Mistral-Small-24B`
5. `Phi3.5`
### Detailed Analysis
**1. Llama3.1-8B (Top Chart)**
* **Y-Axis Range:** ~0.82 to ~0.89.
* **LapEigval (Orange):** Appears as a nearly flat, high line. Values are consistently around 0.885-0.888 across all `k`.
* **AttnLogDet (Green):** A flat horizontal line at approximately 0.842.
* **AttnEigval (Blue):** Shows a clear upward trend. Starts at ~0.821 (k=5), rises to ~0.829 (k=10), ~0.839 (k=25), ~0.842 (k=50), and ~0.843 (k=100). It converges with the AttnLogDet baseline around k=50.
**2. Llama3.2-3B (Second Chart)**
* **Y-Axis Range:** ~0.78 to ~0.835.
* **LapEigval (Orange):** A gently rising line. Starts at ~0.828 (k=5) and increases to ~0.835 (k=100).
* **AttnLogDet (Green):** A flat horizontal line at approximately 0.800.
* **AttnEigval (Blue):** Strong upward trend. Starts at ~0.777 (k=5), rises to ~0.788 (k=10), ~0.799 (k=25), ~0.803 (k=50), and ~0.804 (k=100). It surpasses the AttnLogDet baseline between k=25 and k=50.
**3. Mistral-Nemo (Third Chart)**
* **Y-Axis Range:** ~0.78 to ~0.865.
* **LapEigval (Orange):** Nearly flat, high line. Values are stable around 0.860-0.865.
* **AttnLogDet (Green):** A flat horizontal line at approximately 0.812.
* **AttnEigval (Blue):** Upward trend. Starts at ~0.779 (k=5), rises to ~0.801 (k=10), ~0.818 (k=25), ~0.821 (k=50), and ~0.820 (k=100). It surpasses the AttnLogDet baseline between k=10 and k=25.
**4. Mistral-Small-24B (Fourth Chart)**
* **Y-Axis Range:** ~0.82 to ~0.875.
* **LapEigval (Orange):** Very flat, high line. Values are consistently around 0.874-0.875.
* **AttnLogDet (Green):** A flat horizontal line at approximately 0.833.
* **AttnEigval (Blue):** Steady upward trend. Starts at ~0.817 (k=5), rises to ~0.825 (k=10), ~0.834 (k=25), ~0.840 (k=50), and ~0.844 (k=100). It surpasses the AttnLogDet baseline between k=10 and k=25.
**5. Phi3.5 (Bottom Chart)**
* **Y-Axis Range:** ~0.83 to ~0.875.
* **LapEigval (Orange):** Shows a clear upward trend. Starts at ~0.859 (k=5), rises to ~0.860 (k=10), ~0.864 (k=25), ~0.868 (k=50), and ~0.872 (k=100).
* **AttnLogDet (Green):** A flat horizontal line at approximately 0.848.
* **AttnEigval (Blue):** Upward trend. Starts at ~0.830 (k=5), rises to ~0.846 (k=10), ~0.849 (k=25), ~0.850 (k=50), and ~0.851 (k=100). It surpasses the AttnLogDet baseline between k=10 and k=25.
### Key Observations
1. **Consistent Hierarchy:** In all five models, the `LapEigval` metric (orange) achieves the highest Test AUROC, followed by `AttnEigval` (blue) at higher `k` values, with `AttnLogDet` (green) serving as a lower baseline.
2. **Trend of AttnEigval:** The `AttnEigval` metric shows a consistent, sometimes steep, improvement in performance as `k` (the number of top eigenvalues) increases from 5 to 100. This suggests its effectiveness is sensitive to the amount of spectral information retained.
3. **Stability of LapEigval:** The `LapEigval` metric is remarkably stable and high-performing across all `k` values for most models, showing only a very slight upward trend in some cases (e.g., Phi3.5). This indicates robustness to the choice of `k`.
4. **Baseline Comparison:** The `AttnEigval` metric typically starts below the `AttnLogDet` baseline at low `k` (k=5) but surpasses it as `k` increases, usually between k=10 and k=50.
5. **Model Variation:** While the relative ordering of metrics is consistent, the absolute AUROC values and the steepness of the `AttnEigval` curve vary by model. For example, the improvement from k=5 to k=100 is more pronounced in Llama3.2-3B and Mistral-Nemo than in Llama3.1-8B.
### Interpretation
This data suggests a comparative analysis of different spectral methods for evaluating or analyzing language models, likely in the context of uncertainty estimation, out-of-distribution detection, or model analysis (given the AUROC metric).
* **LapEigval Superiority:** The `LapEigval` (likely Laplacian Eigenvalues) method is demonstrated to be the most effective and robust metric across all tested models. Its high, stable performance implies it captures a fundamental and reliable property of the model's internal representations that correlates well with the evaluation task.
* **AttnEigval's Dependence on `k`:** The `AttnEigval` (Attention Eigenvalues) method is highly dependent on the number of eigenvalues considered. Its poor performance at low `k` suggests the most significant attention eigenvalues alone are not sufficient, but incorporating more of the spectrum (higher `k`) leads to substantial gains, eventually matching or exceeding the `AttnLogDet` baseline.
* **AttnLogDet as a Fixed Baseline:** The `AttnLogDet` (Attention Log-Determinant) appears to be a single-value metric (hence the flat line), providing a consistent but generally lower-performance benchmark against which the `k`-dependent methods are compared.
* **Practical Implication:** If computational cost scales with `k`, there is a clear trade-off for `AttnEigval`. One must choose a `k` high enough to be effective (e.g., k≥25) but not so high as to be inefficient. `LapEigval`, being effective even at low `k`, may be the more practical choice. The analysis validates the use of spectral properties of model weight or activation matrices (Laplacian or Attention) as powerful tools for model evaluation.