## Line Chart: LLaMA2 vs. LLaMA2-FT Accuracy on Various Tasks
### Overview
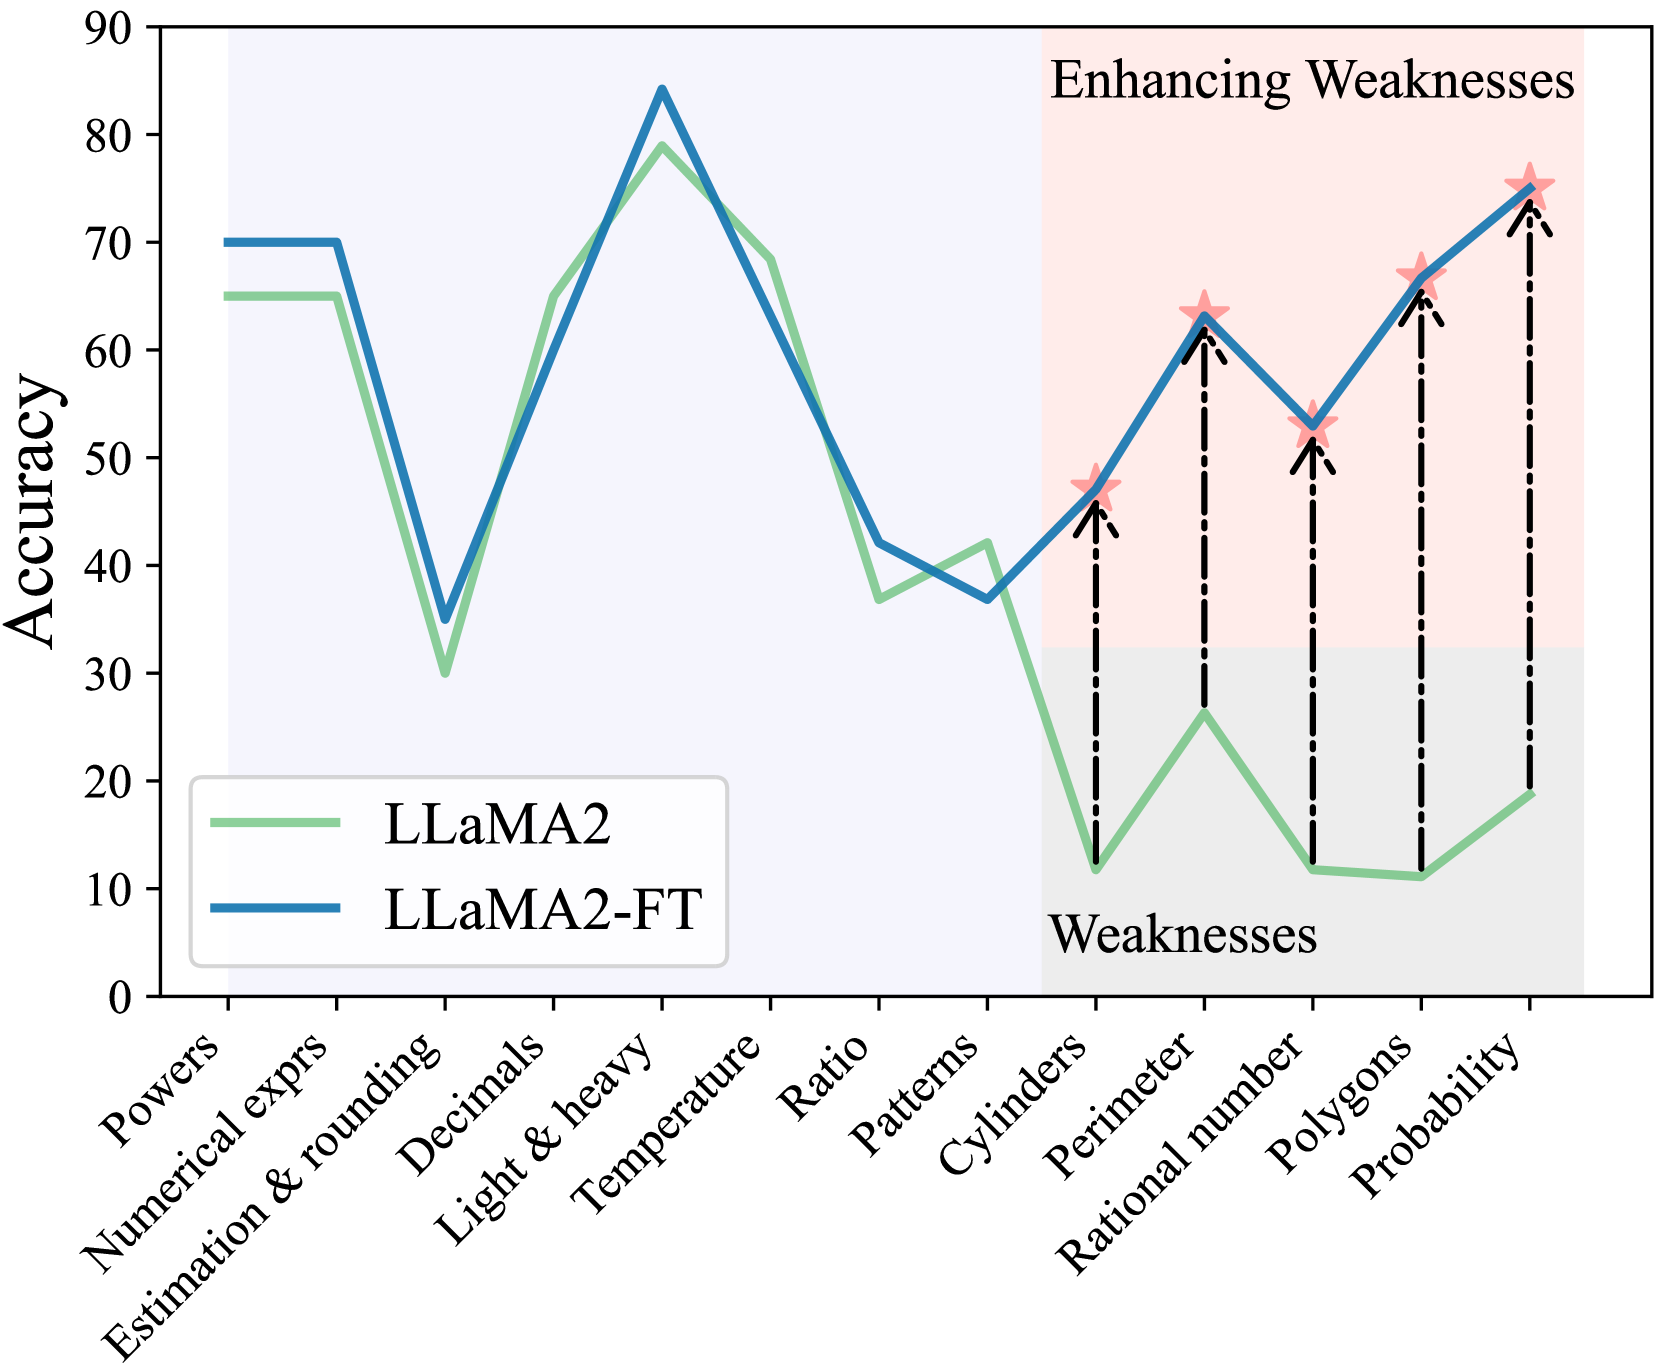
The image is a line chart comparing the accuracy of two models, LLaMA2 and LLaMA2-FT, across a range of tasks. The x-axis represents different task categories, while the y-axis represents accuracy, ranging from 0 to 90. The chart highlights a region where LLaMA2 performs poorly ("Weaknesses") and shows how LLaMA2-FT enhances performance in those areas ("Enhancing Weaknesses").
### Components/Axes
* **Title:** There is no explicit title on the chart.
* **X-axis:** Task categories: Powers, Numerical exprs, Estimation & rounding, Decimals, Light & heavy, Temperature, Ratio, Patterns, Cylinders, Perimeter, Rational number, Polygons, Probability.
* **Y-axis:** Accuracy, ranging from 0 to 90 in increments of 10.
* **Legend:** Located in the bottom-left corner:
* LLaMA2 (light green line)
* LLaMA2-FT (blue line)
* **Regions:**
* A light blue shaded region spans from "Powers" to "Patterns".
* A light red shaded region spans from "Cylinders" to "Probability". This region is labeled "Enhancing Weaknesses" at the top and "Weaknesses" at the bottom.
### Detailed Analysis
* **LLaMA2 (light green line):**
* Powers: ~65
* Numerical exprs: ~65
* Estimation & rounding: ~30
* Decimals: ~65
* Light & heavy: ~80
* Temperature: ~70
* Ratio: ~40
* Patterns: ~35
* Cylinders: ~12
* Perimeter: ~25
* Rational number: ~11
* Polygons: ~11
* Probability: ~20
* **LLaMA2-FT (blue line):**
* Powers: ~70
* Numerical exprs: ~70
* Estimation & rounding: ~35
* Decimals: ~85
* Light & heavy: ~80
* Temperature: ~70
* Ratio: ~42
* Patterns: ~37
* Cylinders: ~45
* Perimeter: ~50
* Rational number: ~62
* Polygons: ~67
* Probability: ~75
* **Trends:**
* LLaMA2: Starts high, drops significantly at "Estimation & rounding", rises sharply to "Light & heavy", then declines gradually with a sharp drop at "Cylinders", then slowly rises again.
* LLaMA2-FT: Similar to LLaMA2 but generally higher, especially in the "Enhancing Weaknesses" region.
* **Enhancing Weaknesses Region:**
* Vertical dashed lines connect the LLaMA2 data points to the corresponding LLaMA2-FT data points in the "Enhancing Weaknesses" region, visually indicating the improvement in accuracy.
* Red star markers are placed on the LLaMA2-FT line at each data point within the "Enhancing Weaknesses" region.
### Key Observations
* LLaMA2-FT consistently outperforms LLaMA2 across all tasks.
* The "Enhancing Weaknesses" region clearly demonstrates the improvement achieved by LLaMA2-FT in tasks where LLaMA2 performs poorly.
* The largest performance gains are observed in "Cylinders", "Perimeter", "Rational number", "Polygons", and "Probability".
### Interpretation
The chart illustrates the effectiveness of fine-tuning (FT) LLaMA2 to improve its accuracy on specific tasks. The "Enhancing Weaknesses" region highlights the targeted improvement achieved by LLaMA2-FT in areas where the base LLaMA2 model struggles. This suggests that fine-tuning is a valuable technique for enhancing the performance of language models on specific domains or tasks. The consistent outperformance of LLaMA2-FT indicates that the fine-tuning process was successful in transferring knowledge and improving the model's ability to handle these tasks. The red stars and dashed lines emphasize the magnitude of the improvement in the "Weaknesses" area.