## Box Plot and Bar Charts: Baseline vs FlowForge Performance
### Overview
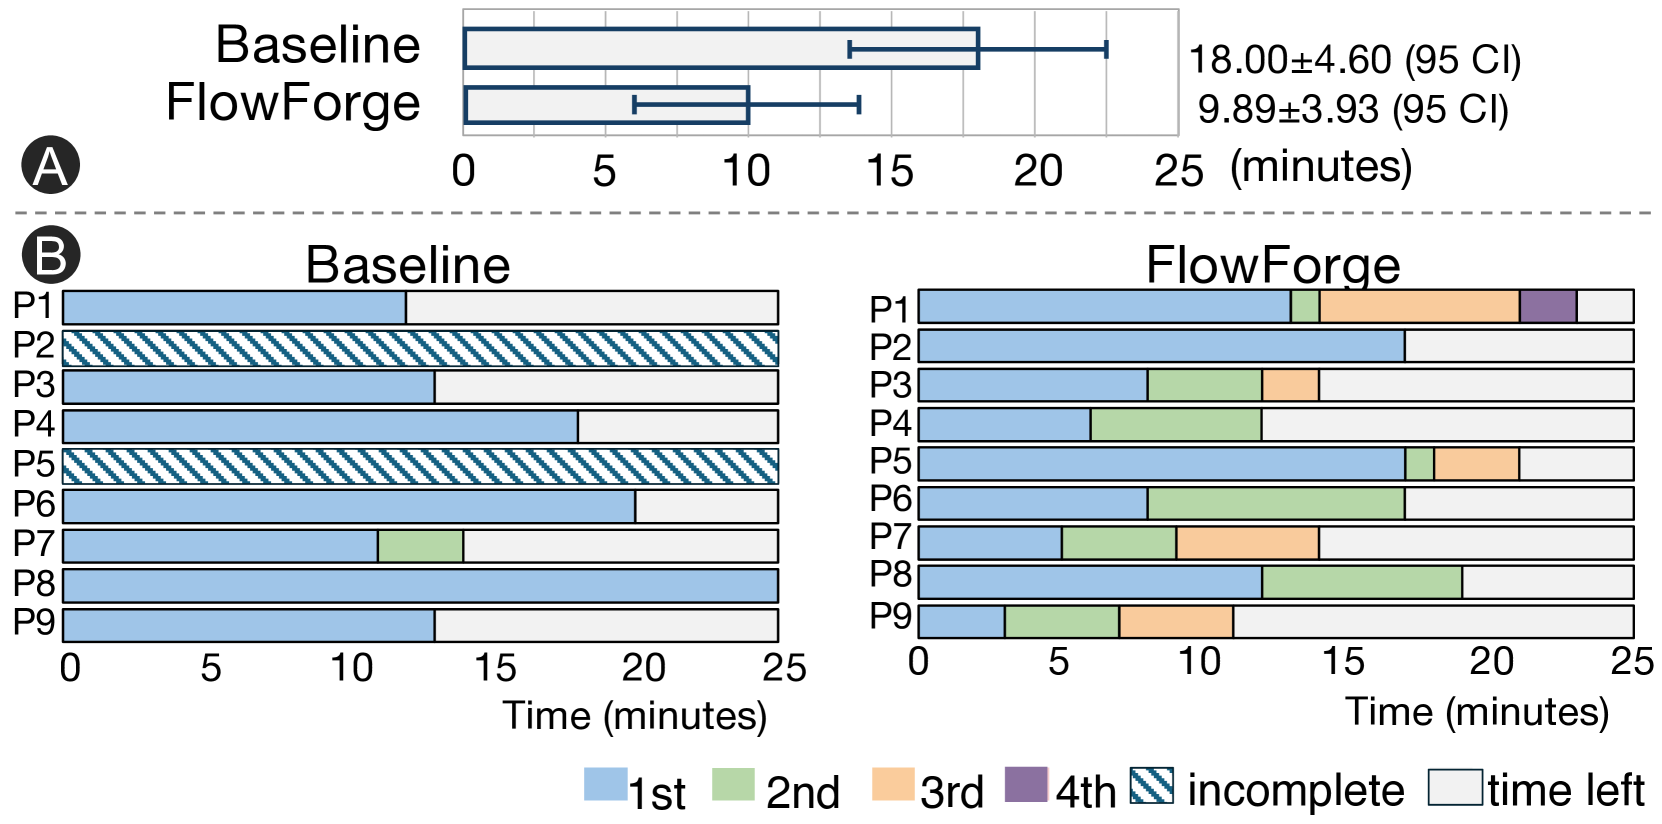
The image compares two performance metrics across two conditions: **Baseline** and **FlowForge**. Section A presents a box plot showing median values and confidence intervals, while Section B displays segmented bar charts for individual participants (P1-P9) under both conditions.
---
### Components/Axes
#### Section A (Box Plot)
- **X-axis**: Time (minutes), scaled from 0 to 25.
- **Y-axis**: Two categories: "Baseline" and "FlowForge".
- **Legend**: Not explicitly labeled in Section A, but statistical annotations are provided:
- Baseline: `18.00 ± 4.60 (95 CI)`
- FlowForge: `9.89 ± 3.93 (95 CI)`
#### Section B (Bar Charts)
- **X-axis**: Time (minutes), scaled from 0 to 25.
- **Y-axis**: Participants labeled P1 to P9.
- **Legend** (bottom center):
- **Blue**: 1st segment
- **Green**: 2nd segment
- **Orange**: 3rd segment
- **Purple**: 4th segment
- **Diagonal stripes**: Incomplete
- **White**: Time left
---
### Detailed Analysis
#### Section A (Box Plot)
- **Baseline**:
- Median: 18.00 minutes
- 95% Confidence Interval: ±4.60 (range: 13.40–22.60)
- **FlowForge**:
- Median: 9.89 minutes
- 95% Confidence Interval: ±3.93 (range: 5.96–13.82)
#### Section B (Bar Charts)
**Baseline**:
- **P1**: Entire bar is blue (1st segment), no incomplete or time left.
- **P2**: Entire bar has diagonal stripes (incomplete).
- **P3**: Blue (1st) + white (time left).
- **P4**: Blue (1st) + white (time left).
- **P5**: Diagonal stripes (incomplete).
- **P6**: Blue (1st) + white (time left).
- **P7**: Blue (1st) + green (2nd) + white (time left).
- **P8**: Full blue (1st segment).
- **P9**: Blue (1st) + white (time left).
**FlowForge**:
- **P1**: Blue (1st) + green (2nd) + orange (3rd) + purple (4th) + white (time left).
- **P2**: Blue (1st) + white (time left).
- **P3**: Blue (1st) + green (2nd) + orange (3rd) + white (time left).
- **P4**: Blue (1st) + green (2nd) + orange (3rd) + white (time left).
- **P5**: Blue (1st) + green (2nd) + orange (3rd) + white (time left).
- **P6**: Blue (1st) + green (2nd) + orange (3rd) + white (time left).
- **P7**: Blue (1st) + green (2nd) + orange (3rd) + white (time left).
- **P8**: Blue (1st) + green (2nd) + orange (3rd) + white (time left).
- **P9**: Blue (1st) + green (2nd) + orange (3rd) + white (time left).
---
### Key Observations
1. **Section A**:
- FlowForge demonstrates a **significantly lower median time** (9.89 vs. 18.00 minutes) with a tighter confidence interval, suggesting improved efficiency.
2. **Section B**:
- **Baseline**:
- 3 participants (P2, P5) show incomplete tasks (diagonal stripes).
- 6 participants have partial time left (white segments).
- **FlowForge**:
- All participants complete tasks across 1st–4th segments, with minimal time left (white segments).
- Structured segmentation (blue, green, orange, purple) indicates phased task completion.
---
### Interpretation
- **Efficiency**: FlowForge reduces task completion time by ~45% compared to Baseline, with greater consistency (narrower CI).
- **Task Structure**: FlowForge’s segmented approach eliminates incomplete tasks and minimizes time left, implying better resource allocation or workflow optimization.
- **Participant Variability**: Baseline shows higher variability in task completion (e.g., P2 and P5 fully incomplete), while FlowForge standardizes performance across participants.
- **Unresolved Questions**: The purpose of the 4th segment (purple) in FlowForge is unclear but may represent a final validation or review phase.
---
### Spatial Grounding
- **Section A**: Box plot centered above the two bar charts, with statistical annotations to the right.
- **Section B**:
- Baseline chart on the left, FlowForge on the right.
- Legend positioned at the bottom center, aligned with both charts.
---
### Content Details
- **Statistical Values**:
- Baseline: `18.00 ± 4.60 (95 CI)`
- FlowForge: `9.89 ± 3.93 (95 CI)`
- **Legend Colors**:
- Blue (1st), Green (2nd), Orange (3rd), Purple (4th), Diagonal stripes (incomplete), White (time left).
---
### Final Notes
The data suggests FlowForge optimizes task completion through structured segmentation, reducing variability and inefficiencies observed in the Baseline condition. Further investigation into the 4th segment’s role could clarify its contribution to performance gains.