\n
## Chart: Cumulative Density Function of Relative Absolute Error
### Overview
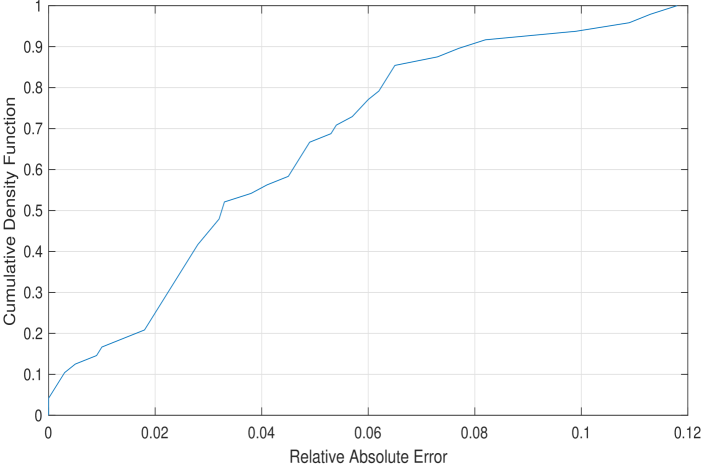
The image presents a cumulative density function (CDF) plot, illustrating the distribution of relative absolute errors. The x-axis represents the relative absolute error, and the y-axis represents the cumulative density function value. The plot shows how the probability of observing a relative absolute error less than or equal to a given value changes.
### Components/Axes
* **X-axis Title:** "Relative Absolute Error"
* Scale: Ranges from approximately 0 to 0.12.
* Markers: 0, 0.02, 0.04, 0.06, 0.08, 0.10, 0.12
* **Y-axis Title:** "Cumulative Density Function"
* Scale: Ranges from 0 to 1.
* Markers: 0, 0.2, 0.4, 0.6, 0.8, 1.0
* **Data Series:** A single blue line representing the CDF.
* **Grid:** A light gray grid is present to aid in reading values.
### Detailed Analysis
The blue line representing the CDF starts at approximately (0, 0.05). The line exhibits a steep upward slope between approximately 0.02 and 0.06 on the x-axis, indicating a rapid increase in the cumulative probability. The slope gradually decreases as the relative absolute error increases, approaching a value of approximately 0.98 at x = 0.10 and reaching approximately 0.99 at x = 0.12.
Here's a reconstruction of approximate data points:
* (0, 0.05)
* (0.02, 0.15)
* (0.04, 0.35)
* (0.06, 0.55)
* (0.08, 0.75)
* (0.10, 0.90)
* (0.12, 0.99)
### Key Observations
* The CDF shows that a significant portion of the relative absolute errors are concentrated below 0.06.
* The curve plateaus towards the higher end of the relative absolute error range, indicating that very large errors are relatively rare.
* The CDF is monotonically increasing, as expected.
### Interpretation
The data suggests that the model or process being evaluated generally exhibits low relative absolute errors. The rapid increase in the CDF between 0.02 and 0.06 indicates that the majority of errors fall within this range. The plateau at the higher end suggests that while larger errors do occur, they are infrequent. This CDF provides a visual representation of the error distribution, allowing for an assessment of the model's accuracy and reliability. The shape of the CDF is consistent with a distribution that is skewed towards lower error values. This could be due to the nature of the data, the model's design, or the optimization process used during training. Further analysis, such as calculating the mean and standard deviation of the relative absolute errors, would provide a more complete understanding of the error distribution.