## Line Chart: Surprisal vs. Training Steps
### Overview
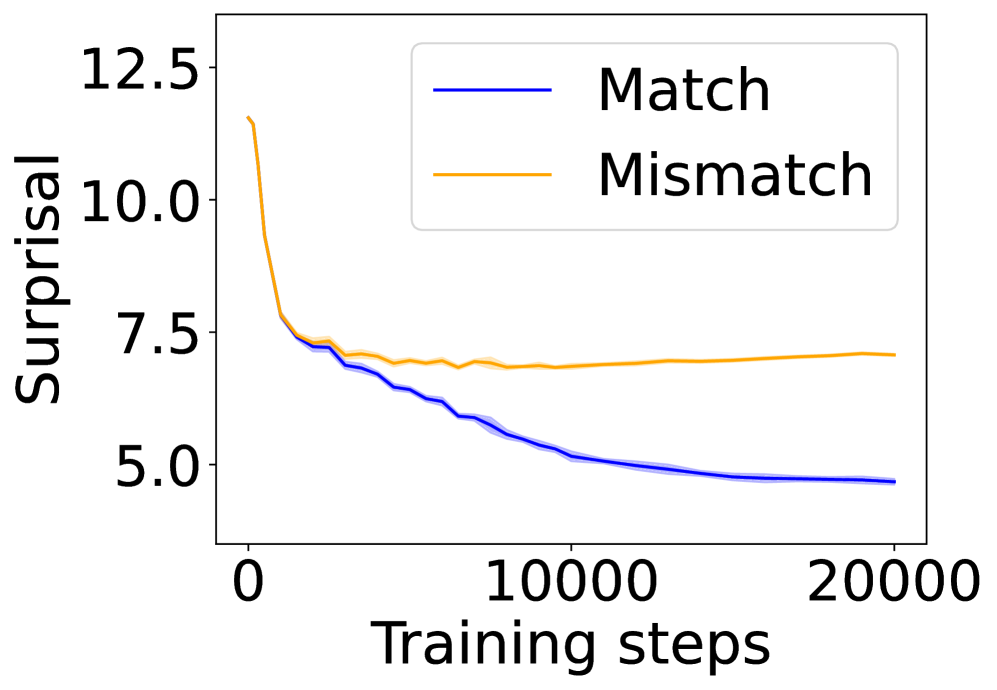
The image is a line chart showing the relationship between "Surprisal" and "Training steps" for two conditions: "Match" and "Mismatch". The chart illustrates how surprisal changes as the number of training steps increases.
### Components/Axes
* **X-axis:** "Training steps" with values ranging from 0 to 20000.
* **Y-axis:** "Surprisal" with values ranging from 5.0 to 12.5.
* **Legend:** Located in the top-right corner, it identifies the two data series:
* Blue line: "Match"
* Orange line: "Mismatch"
### Detailed Analysis
* **Match (Blue Line):**
* Trend: The "Match" line shows a decreasing trend.
* Data Points:
* At 0 training steps, surprisal is approximately 7.5.
* At 5000 training steps, surprisal is approximately 6.0.
* At 10000 training steps, surprisal is approximately 5.5.
* At 20000 training steps, surprisal is approximately 4.7.
* **Mismatch (Orange Line):**
* Trend: The "Mismatch" line shows a sharp decreasing trend initially, then plateaus.
* Data Points:
* At 0 training steps, surprisal is approximately 12.0.
* At 5000 training steps, surprisal is approximately 7.2.
* At 10000 training steps, surprisal is approximately 7.2.
* At 20000 training steps, surprisal is approximately 7.3.
### Key Observations
* The "Mismatch" condition starts with a much higher surprisal value than the "Match" condition.
* Both conditions show a decrease in surprisal as training steps increase, but the "Match" condition decreases more consistently.
* The "Mismatch" condition plateaus after the initial drop, indicating that further training steps have little effect on reducing surprisal.
* The shaded regions around each line likely represent the standard deviation or confidence interval, indicating the variability in the data.
### Interpretation
The chart suggests that the model learns to handle "Match" conditions more effectively than "Mismatch" conditions as training progresses. The "Match" condition shows a continuous decrease in surprisal, indicating that the model is becoming more confident and accurate in its predictions. In contrast, the "Mismatch" condition plateaus, suggesting that the model struggles to reduce its uncertainty even with more training. This could indicate that the "Mismatch" condition is inherently more difficult to predict or that the model requires a different approach to learn it effectively. The initial high surprisal for "Mismatch" suggests that these cases are initially unexpected or difficult for the model to process.