## Diagram: Causal Diagram
### Overview
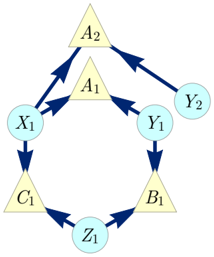
The image is a causal diagram showing relationships between variables. The diagram consists of nodes represented by triangles and circles, connected by directed edges (arrows) indicating causal influences.
### Components/Axes
* **Nodes:**
* Triangles: Represent variables A2, A1, C1, and B1.
* Circles: Represent variables X1, Y1, Y2, and Z1.
* **Edges:** Directed arrows indicating the direction of causal influence.
### Detailed Analysis or ### Content Details
The diagram shows the following relationships:
* A2 influences X1 and Y2.
* A2 influences A1.
* A1 influences X1 and Y1.
* X1 influences C1.
* Y1 influences B1.
* C1 influences Z1.
* B1 influences Z1.
### Key Observations
* The diagram forms a cyclical structure.
* A2 appears to be a root node, influencing multiple other nodes.
* Z1 is influenced by both C1 and B1.
### Interpretation
The diagram represents a causal model where the variables are interconnected. The arrows indicate the direction of influence, suggesting how changes in one variable might affect others. The cyclical structure implies feedback loops or complex interactions between the variables. The diagram could be used to analyze the potential effects of interventions or to understand the underlying mechanisms driving the system.