## Radar Charts: Token Efficiency Before and After Toggle Across Benchmarks
### Overview
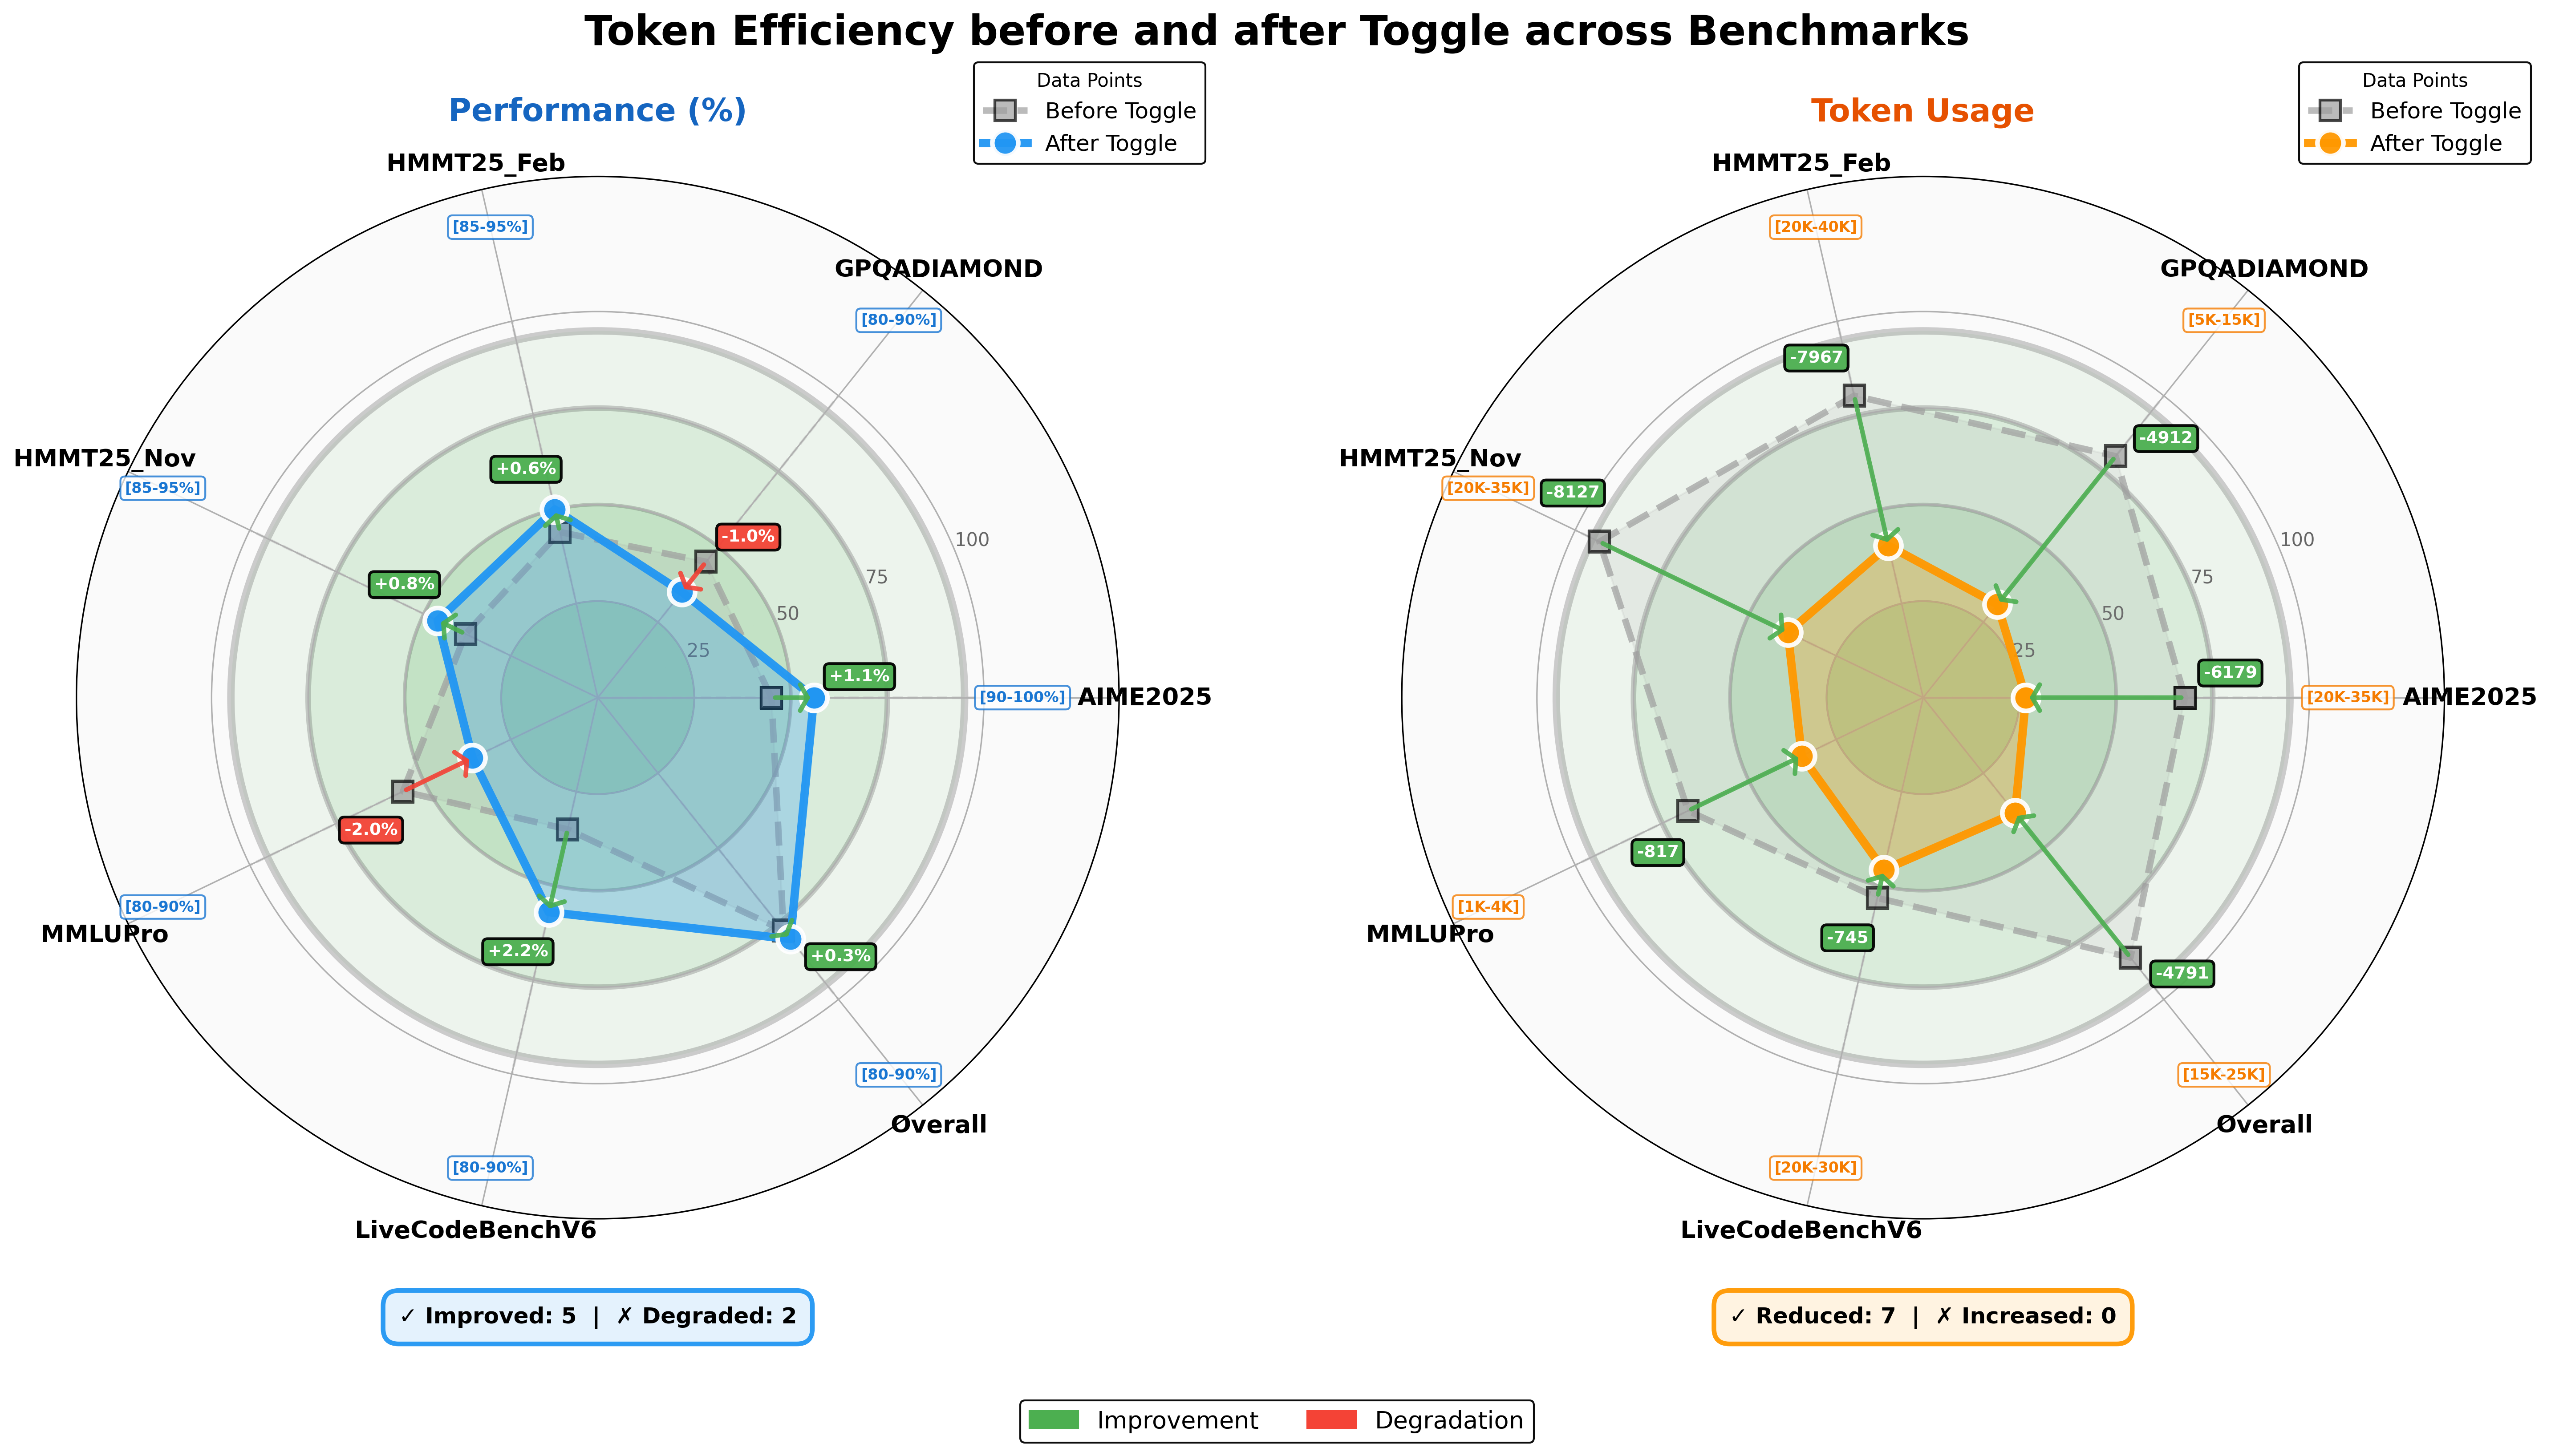
The image presents two radar charts comparing "Before Toggle" and "After Toggle" data for "Performance (%)" and "Token Usage" across several benchmarks. Each chart has six categories arranged radially, with concentric circles indicating percentage or token count scales. The charts visually represent the impact of a toggle on performance and token usage.
### Components/Axes
**Common Elements:**
* **Title:** "Token Efficiency before and after Toggle across Benchmarks"
* **Data Points Legend (Top-Right of each chart):**
* Gray Square: "Before Toggle"
* Blue/Orange Circle: "After Toggle"
* **Categories (Benchmarks):** HMMT25\_Feb, GPQADIAMOND, AIME2025, Overall, LiveCodeBenchV6, MMLUPro, HMMT25\_Nov
* **Radial Grid:** Concentric circles representing values.
**Left Chart - Performance (%):**
* **Title:** "Performance (%)"
* **Scale:** 0 to 100, with increments of 25.
* **Category Ranges (Near Category Labels):** \[85-95%], \[80-90%], \[90-100%], \[80-90%], \[80-90%], \[80-90%], \[85-95%]
* **Data Series:**
* "Before Toggle": Represented by a dashed gray line with square markers.
* "After Toggle": Represented by a solid blue line with circular markers.
* **Improvement/Degradation Legend (Bottom):**
* Green: Improvement
* Red: Degradation
* **Summary (Bottom):** "✓ Improved: 5 | X Degraded: 2"
**Right Chart - Token Usage:**
* **Title:** "Token Usage"
* **Scale:** 0 to 100 (likely representing a normalized token count, but the units are not explicitly stated).
* **Category Ranges (Near Category Labels):** \[20K-40K], \[5K-15K], \[20K-35K], \[15K-25K], \[20K-30K], \[1K-4K], \[20K-35K]
* **Data Series:**
* "Before Toggle": Represented by a dashed gray line with square markers.
* "After Toggle": Represented by a solid orange line with circular markers.
* **Improvement/Degradation Legend (Bottom):**
* Green: Improvement
* Red: Degradation (though no red is present)
* **Summary (Bottom):** "✓ Reduced: 7 | X Increased: 0"
### Detailed Analysis
**Left Chart - Performance (%):**
* **HMMT25\_Feb:**
* Before Toggle: Approximately 50%
* After Toggle: Approximately 50% + 0.6% = 50.6%
* Change: +0.6% (Green - Improvement)
* **GPQADIAMOND:**
* Before Toggle: Approximately 60%
* After Toggle: Approximately 59%
* Change: -1.0% (Red - Degradation)
* **AIME2025:**
* Before Toggle: Approximately 30%
* After Toggle: Approximately 31.1%
* Change: +1.1% (Green - Improvement)
* **Overall:**
* Before Toggle: Approximately 20%
* After Toggle: Approximately 20.3%
* Change: +0.3% (Green - Improvement)
* **LiveCodeBenchV6:**
* Before Toggle: Approximately 18%
* After Toggle: Approximately 20.2%
* Change: +2.2% (Green - Improvement)
* **MMLUPro:**
* Before Toggle: Approximately 32%
* After Toggle: Approximately 30%
* Change: -2.0% (Red - Degradation)
* **HMMT25\_Nov:**
* Before Toggle: Approximately 40%
* After Toggle: Approximately 40.8%
* Change: +0.8% (Green - Improvement)
**Right Chart - Token Usage:**
* **HMMT25\_Feb:**
* Before Toggle: Approximately 28,000
* After Toggle: Approximately 20,033
* Change: -7967
* **GPQADIAMOND:**
* Before Toggle: Approximately 12,000
* After Toggle: Approximately 7088
* Change: -4912
* **AIME2025:**
* Before Toggle: Approximately 26,000
* After Toggle: Approximately 19,821
* Change: -6179
* **Overall:**
* Before Toggle: Approximately 21,000
* After Toggle: Approximately 16,209
* Change: -4791
* **LiveCodeBenchV6:**
* Before Toggle: Approximately 27,000
* After Toggle: Approximately 26,255
* Change: -745
* **MMLUPro:**
* Before Toggle: Approximately 2,000
* After Toggle: Approximately 1,183
* Change: -817
* **HMMT25\_Nov:**
* Before Toggle: Approximately 28,000
* After Toggle: Approximately 19,873
* Change: -8127
### Key Observations
* **Performance:** The "After Toggle" performance is generally improved across most benchmarks, as indicated by the "Improved: 5 | Degraded: 2" summary.
* **Token Usage:** The "After Toggle" token usage is reduced across all benchmarks, as indicated by the "Reduced: 7 | Increased: 0" summary.
* **Magnitude of Change:** The magnitude of token usage reduction varies significantly across benchmarks.
* **Category Ranges:** The category ranges are different for each benchmark.
### Interpretation
The data suggests that the "Toggle" has a positive impact by generally improving performance and consistently reducing token usage across the tested benchmarks. The performance improvements are relatively small, while the token usage reductions are more substantial. The specific impact varies depending on the benchmark, indicating that the "Toggle" may interact differently with different types of workloads or data. The category ranges provide context for the expected performance and token usage levels for each benchmark. The consistent reduction in token usage, coupled with performance improvements in most cases, suggests that the "Toggle" is an effective optimization strategy.