## Image Analysis: 3DGS Reconstruction Comparison
### Overview
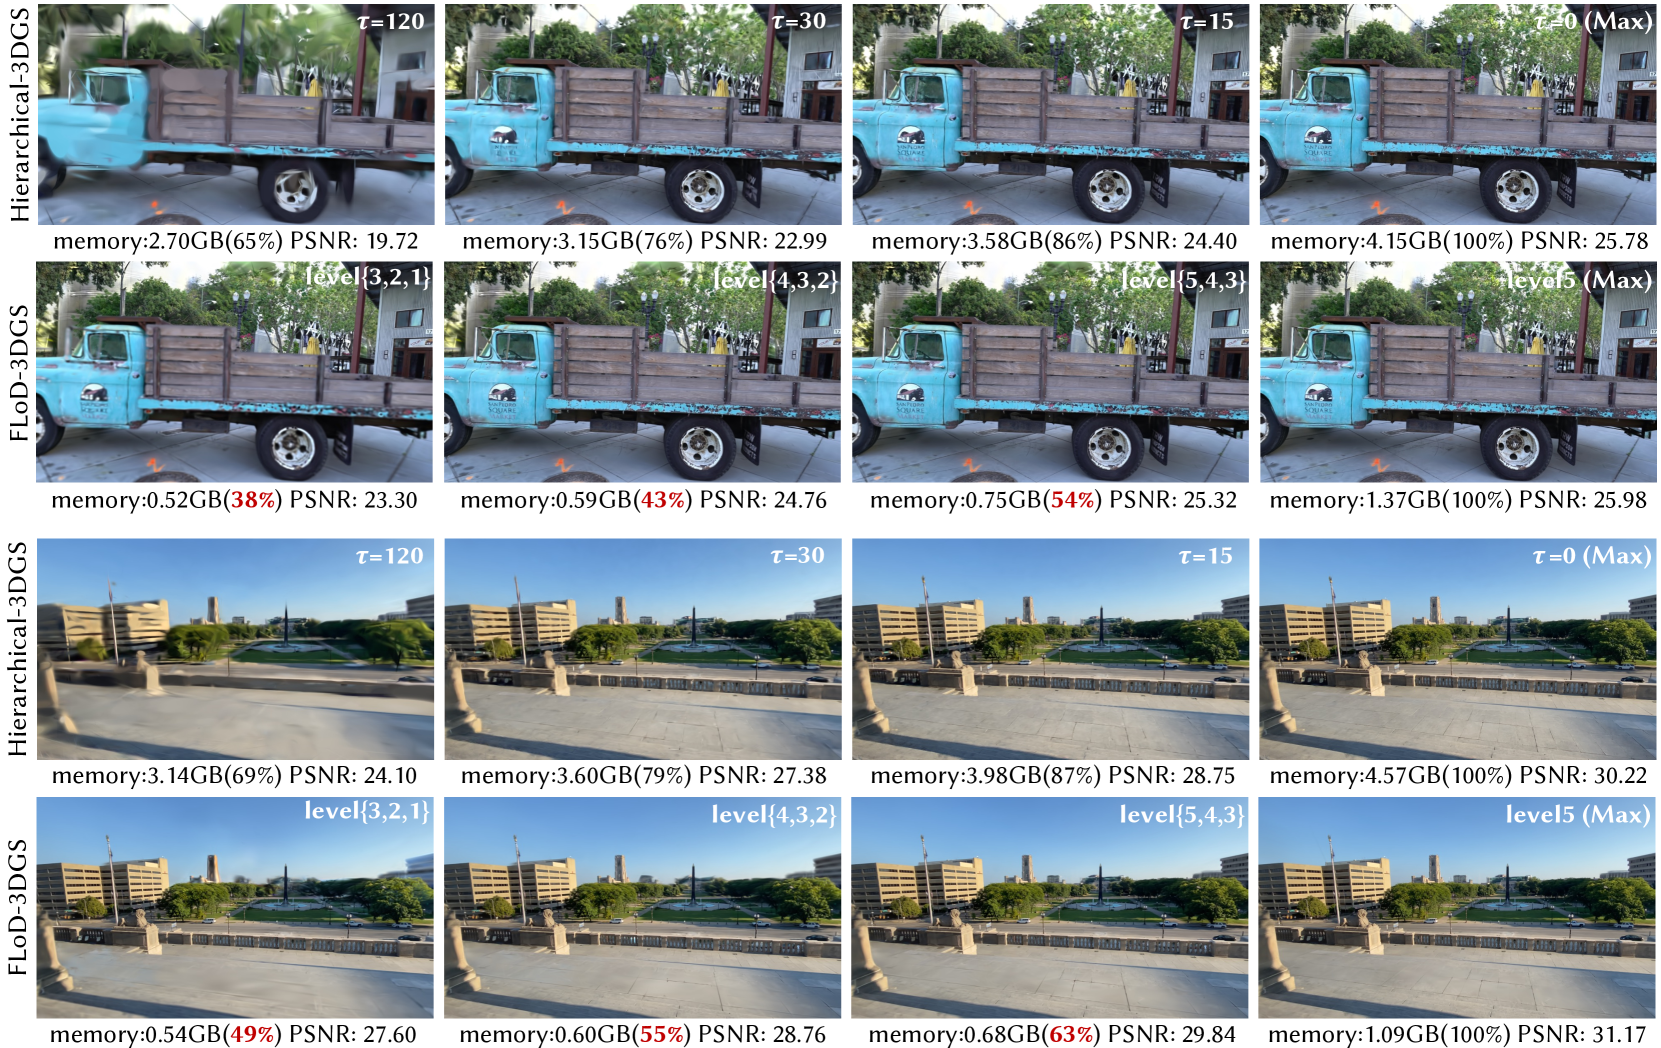
The image presents a comparative analysis of 3D reconstruction quality using two different methods: Hierarchical-3DGS and FloD-3DGS. Four snapshots are shown for each method, representing different time steps (t = 120, t = 30, t = 15, and t = 0 (Max)). Each snapshot displays a rendered image of a truck and a background scene, along with associated performance metrics: memory usage (in GB) and Peak Signal-to-Noise Ratio (PSNR).
### Components/Axes
The image is organized in a 2x4 grid. The rows represent the two methods (Hierarchical-3DGS and FloD-3DGS). The columns represent different time steps (t=120, t=30, t=15, t=0 (Max)). Each cell contains a rendered image and associated text labels indicating memory usage and PSNR. There are also labels indicating the level of detail used in the reconstruction (e.g., level[3,2,1], level[4,3,2], level[5,4,3], level 5).
### Detailed Analysis or Content Details
**Hierarchical-3DGS:**
* **t = 120:** Memory: 3.14GB (69%), PSNR: 24.10
* **t = 30:** Memory: 3.60GB (79%), PSNR: 27.38
* **t = 15:** Memory: 3.98GB (87%), PSNR: 28.75
* **t = 0 (Max):** Memory: 4.57GB (100%), PSNR: 30.22
**FloD-3DGS:**
* **t = 120:** Memory: 0.54GB (49%), PSNR: 27.60
* **t = 30:** Memory: 0.60GB (55%), PSNR: 28.76
* **t = 15:** Memory: 0.68GB (63%), PSNR: 29.84
* **t = 0 (Max):** Memory: 1.09GB (100%), PSNR: 31.17
**Level Labels:**
* **t = 120:** level[3,2,1]
* **t = 30:** level[4,3,2]
* **t = 15:** level[5,4,3]
* **t = 0 (Max):** level 5
**Visual Trends:**
* **Hierarchical-3DGS:** PSNR generally increases as time decreases (from t=120 to t=0), indicating improved reconstruction quality. Memory usage also increases with decreasing time.
* **FloD-3DGS:** Similar to Hierarchical-3DGS, PSNR increases and memory usage increases as time decreases.
### Key Observations
* FloD-3DGS consistently achieves higher PSNR values than Hierarchical-3DGS across all time steps.
* FloD-3DGS uses significantly less memory than Hierarchical-3DGS.
* The memory usage for both methods reaches 100% at t=0 (Max).
* The level of detail increases as time decreases, as indicated by the level labels.
### Interpretation
The data suggests that FloD-3DGS is a more efficient and effective method for 3D reconstruction compared to Hierarchical-3DGS. It achieves better reconstruction quality (higher PSNR) while using considerably less memory. The increasing PSNR and memory usage as time decreases indicate that the reconstruction quality improves and more resources are utilized as the algorithm converges towards a final, detailed reconstruction. The level labels confirm that the level of detail increases over time. The fact that memory usage reaches 100% at the final time step suggests that the algorithm is utilizing all available memory to achieve the highest possible reconstruction quality. The difference in memory usage between the two methods could be due to different data structures or optimization strategies employed in each algorithm. The higher PSNR values for FloD-3DGS suggest that it is better at preserving details and reducing noise during the reconstruction process.