## Comparative Analysis: Hierarchical-3DGS vs. FLoD-3DGS Rendering Quality and Memory Usage
### Overview
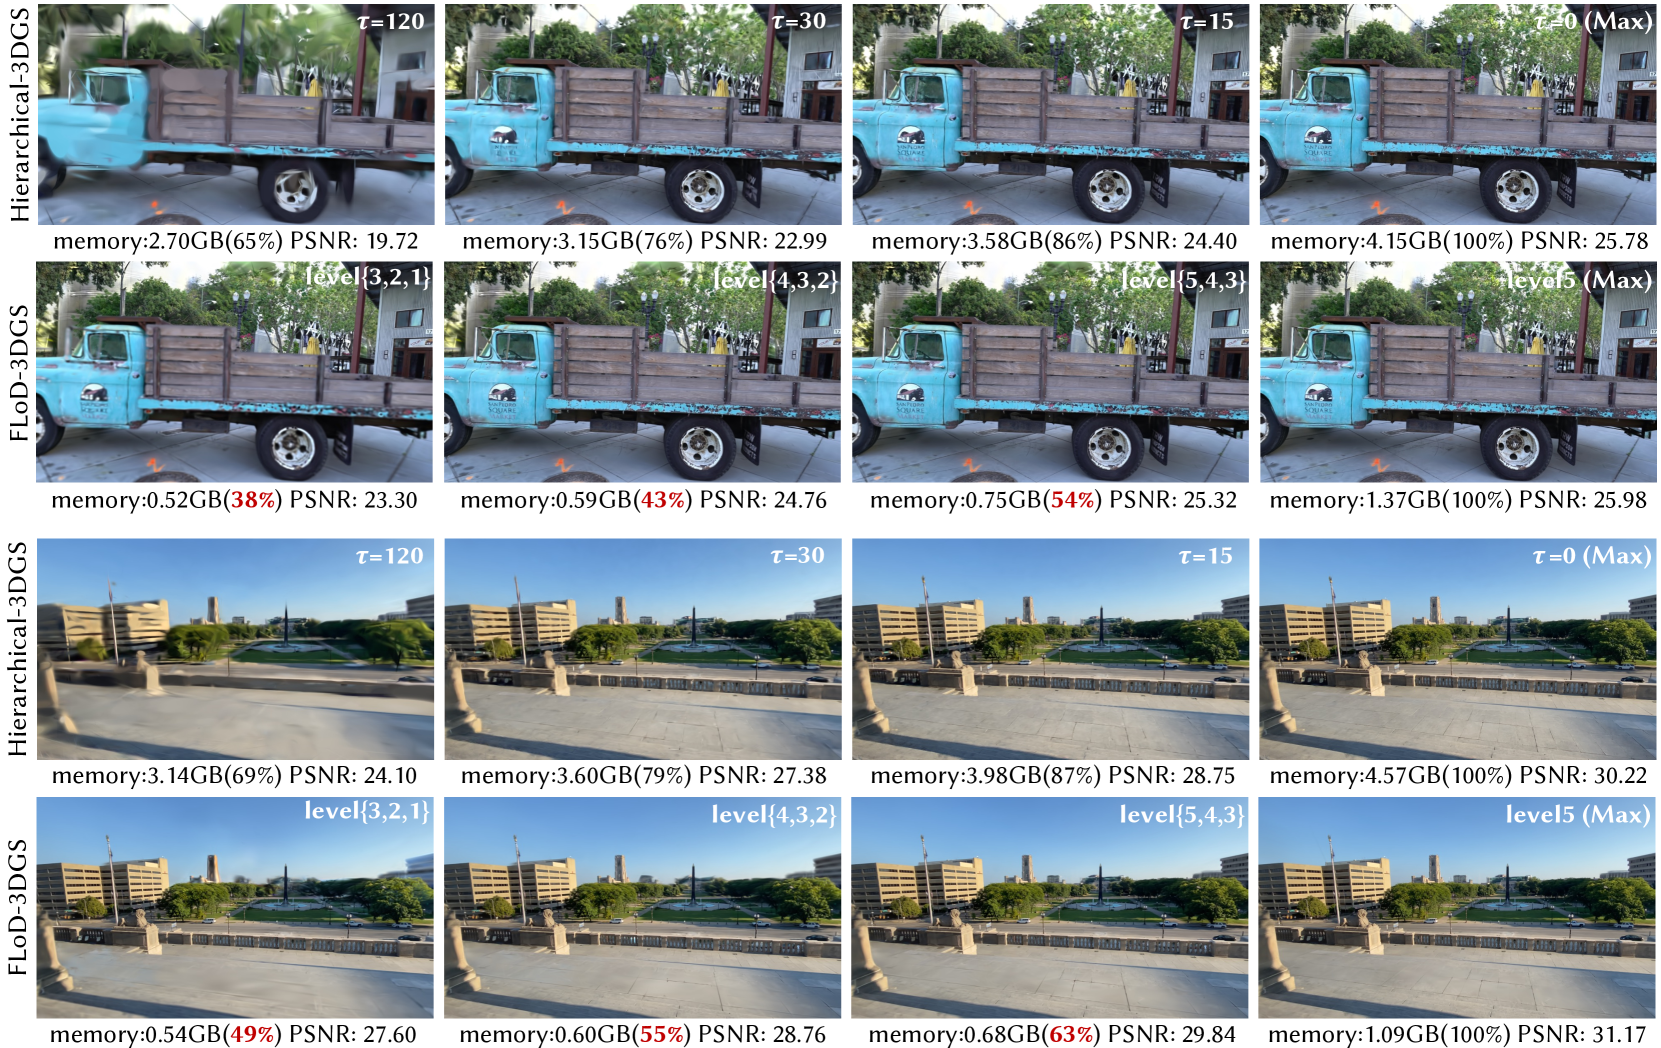
The image presents a side-by-side visual and quantitative comparison of two 3D Gaussian Splatting (3DGS) rendering methods: **Hierarchical-3DGS** and **FLoD-3DGS**. The comparison is conducted across two distinct scenes: a close-up of a vintage blue truck and a wider shot of a building plaza. For each method and scene, four progressive quality levels are shown, with corresponding metrics for memory consumption and image quality (PSNR).
### Components/Axes
The image is organized into a 4x4 grid, segmented into four primary horizontal rows.
* **Row 1 (Top):** **Hierarchical-3DGS** applied to the **Truck Scene**.
* **Parameter:** `τ` (tau), with values decreasing from left to right: `τ=120`, `τ=30`, `τ=15`, `τ=0 (Max)`.
* **Metrics per panel:** Memory usage in GB and as a percentage of maximum, and Peak Signal-to-Noise Ratio (PSNR).
* **Row 2:** **FLoD-3DGS** applied to the **Truck Scene**.
* **Parameter:** Level sets, with complexity increasing from left to right: `level{3,2,1}`, `level{4,3,2}`, `level{5,4,3}`, `level5 (Max)`.
* **Metrics per panel:** Memory usage in GB and as a percentage of maximum, and PSNR.
* **Row 3:** **Hierarchical-3DGS** applied to the **Building Scene**.
* **Parameter:** Same `τ` progression as Row 1.
* **Metrics per panel:** Memory usage in GB and as a percentage of maximum, and PSNR.
* **Row 4 (Bottom):** **FLoD-3DGS** applied to the **Building Scene**.
* **Parameter:** Same level set progression as Row 2.
* **Metrics per panel:** Memory usage in GB and as a percentage of maximum, and PSNR.
**Visual Elements:** Each panel contains a rendered image of the scene. The visual quality (sharpness, detail) improves from left to right within each row. The memory percentage and PSNR values are overlaid as text at the bottom of each panel.
### Detailed Analysis
#### Truck Scene Data
**Hierarchical-3DGS (Row 1):**
* **Trend:** As `τ` decreases (120 → 0), memory usage increases, and PSNR improves.
* **Data Points:**
* `τ=120`: Memory: 2.70GB (65%), PSNR: 19.72
* `τ=30`: Memory: 3.15GB (76%), PSNR: 22.99
* `τ=15`: Memory: 3.58GB (86%), PSNR: 24.40
* `τ=0 (Max)`: Memory: 4.15GB (100%), PSNR: 25.78
**FLoD-3DGS (Row 2):**
* **Trend:** As the level set complexity increases, memory usage increases, and PSNR improves.
* **Data Points:**
* `level{3,2,1}`: Memory: 0.52GB (38%), PSNR: 23.30
* `level{4,3,2}`: Memory: 0.59GB (43%), PSNR: 24.76
* `level{5,4,3}`: Memory: 0.75GB (54%), PSNR: 25.32
* `level5 (Max)`: Memory: 1.37GB (100%), PSNR: 25.98
#### Building Scene Data
**Hierarchical-3DGS (Row 3):**
* **Trend:** As `τ` decreases (120 → 0), memory usage increases, and PSNR improves.
* **Data Points:**
* `τ=120`: Memory: 3.14GB (69%), PSNR: 24.10
* `τ=30`: Memory: 3.60GB (79%), PSNR: 27.38
* `τ=15`: Memory: 3.98GB (87%), PSNR: 28.75
* `τ=0 (Max)`: Memory: 4.57GB (100%), PSNR: 30.22
**FLoD-3DGS (Row 4):**
* **Trend:** As the level set complexity increases, memory usage increases, and PSNR improves.
* **Data Points:**
* `level{3,2,1}`: Memory: 0.54GB (49%), PSNR: 27.60
* `level{4,3,2}`: Memory: 0.60GB (55%), PSNR: 28.76
* `level{5,4,3}`: Memory: 0.68GB (63%), PSNR: 29.84
* `level5 (Max)`: Memory: 1.09GB (100%), PSNR: 31.17
### Key Observations
1. **Memory Efficiency:** FLoD-3DGS is dramatically more memory-efficient than Hierarchical-3DGS at comparable or even superior quality levels. For example, in the truck scene, FLoD-3DGS at its *lowest* quality (0.52GB, PSNR 23.30) uses less than 1/5th the memory of Hierarchical-3DGS at its *highest* quality (4.15GB, PSNR 25.78) while achieving a PSNR only 2.48 dB lower.
2. **Quality Ceiling:** In both scenes, the maximum quality (PSNR) achieved by FLoD-3DGS (`level5 (Max)`) is slightly higher than that of Hierarchical-3DGS (`τ=0 (Max)`). Truck: 25.98 vs. 25.78. Building: 31.17 vs. 30.22.
3. **Visual Fidelity:** The visual improvement from left to right is clear in both methods, with textures (wood grain on the truck, building facades) becoming sharper and less blurry. The visual difference between the highest quality settings of the two methods is minimal to the naked eye.
4. **Scene Dependency:** The absolute PSNR values are higher for the building scene than the truck scene for both methods, suggesting the building scene may be inherently easier to reconstruct or render.
### Interpretation
This comparison demonstrates a significant advancement in efficiency for 3D Gaussian Splatting rendering. The **FLoD-3DGS** method achieves a superior **quality-to-memory ratio**.
* **What the data suggests:** FLoD-3DGS likely employs a more sophisticated level-of-detail (LoD) or culling mechanism, allowing it to allocate memory resources more intelligently. It can produce high-fidelity results using a fraction of the memory required by the Hierarchical approach. The fact that its maximum quality is slightly higher also suggests its representation may be more effective or complete when fully deployed.
* **Relationship between elements:** The core relationship shown is the trade-off between resource consumption (memory) and output quality (PSNR). Both methods follow the expected curve where more resources yield better quality, but FLoD-3DGS's curve is shifted dramatically to the left (more efficient).
* **Notable implications:** For real-time applications, mobile deployment, or scenes with strict memory budgets, FLoD-3DGS presents a compelling advantage. It enables high-quality 3D rendering on hardware that could not support the memory demands of the Hierarchical method at similar fidelity. The data strongly argues for the adoption of more efficient, level-based splatting techniques over purely hierarchical ones.