\n
## Bar Chart: Performance Speedup by Threshold and Workload
### Overview
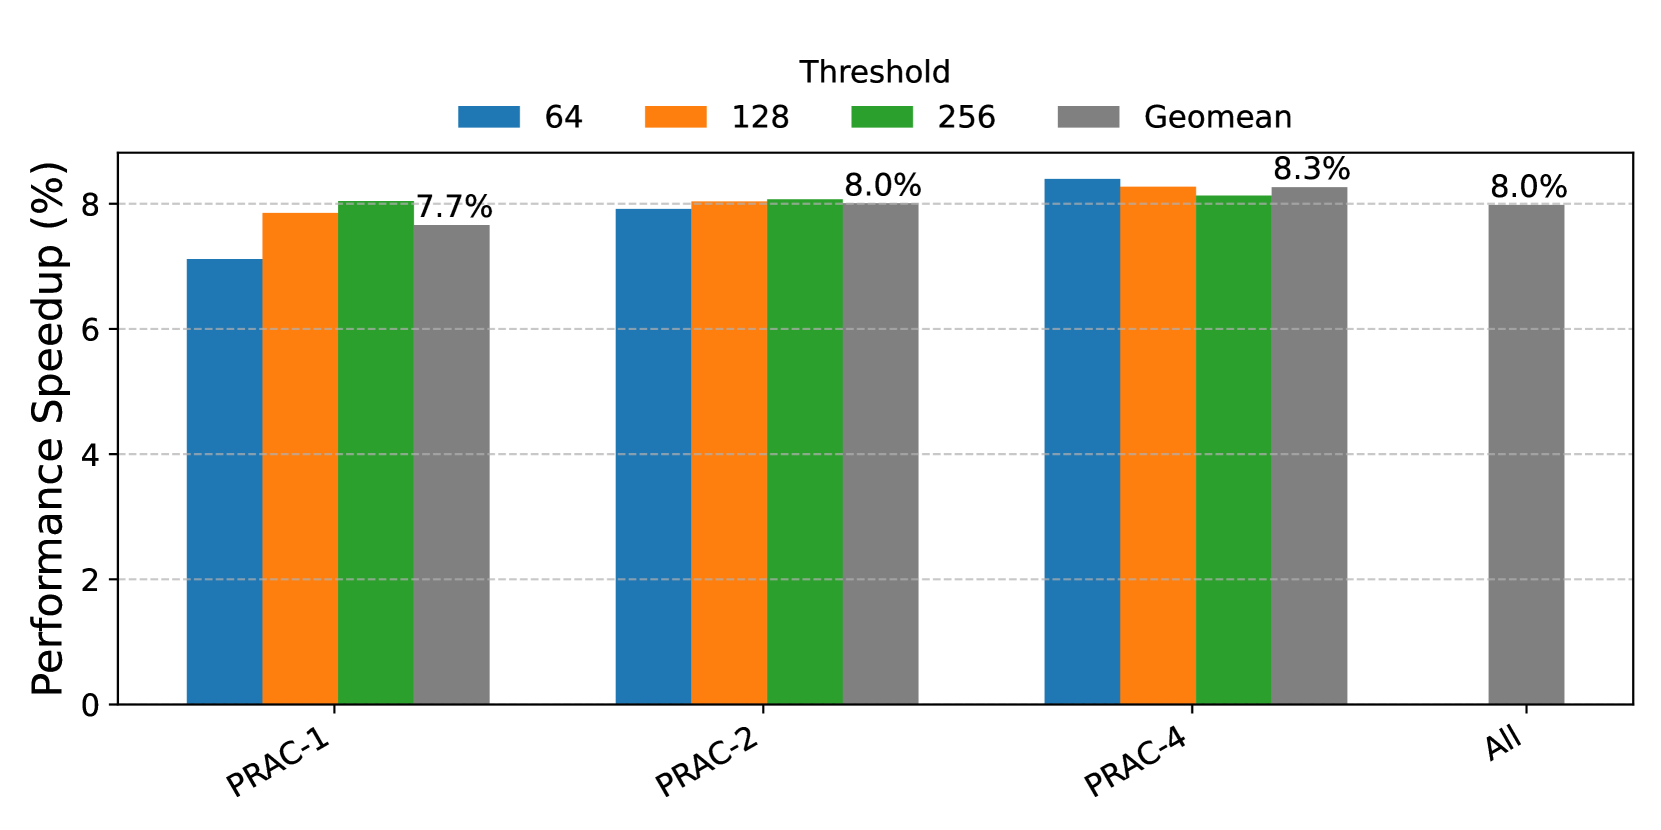
This bar chart displays the performance speedup (in percentage) achieved for different workloads (PRAC-1, PRAC-2, PRAC-4, and All) using varying thresholds (64, 128, 256, and Geomean). The y-axis represents the performance speedup percentage, while the x-axis represents the workload. Each workload has four bars corresponding to the different thresholds.
### Components/Axes
* **X-axis:** Workload - labeled with "PRAC-1", "PRAC-2", "PRAC-4", and "All".
* **Y-axis:** Performance Speedup (%) - ranging from 0% to 8.5%.
* **Legend:** Located at the top-right of the chart, identifying the thresholds:
* Blue: 64
* Orange: 128
* Green: 256
* Gray: Geomean
### Detailed Analysis
The chart consists of 16 data points (4 workloads x 4 thresholds). Here's a breakdown of the speedup percentages for each combination:
* **PRAC-1:**
* Threshold 64: Approximately 6.9%
* Threshold 128: Approximately 7.7%
* Threshold 256: Approximately 7.7%
* Geomean: Approximately 7.7%
* **PRAC-2:**
* Threshold 64: Approximately 7.9%
* Threshold 128: Approximately 8.0%
* Threshold 256: Approximately 8.0%
* Geomean: Approximately 8.0%
* **PRAC-4:**
* Threshold 64: Approximately 8.2%
* Threshold 128: Approximately 8.3%
* Threshold 256: Approximately 8.3%
* Geomean: Approximately 8.3%
* **All:**
* Threshold 64: Approximately 7.8%
* Threshold 128: Approximately 8.0%
* Threshold 256: Approximately 8.0%
* Geomean: Approximately 8.0%
For each workload, the speedup generally increases as the threshold increases from 64 to 128, and then plateaus or shows minimal increase from 128 to 256. The Geomean speedup is generally consistent with the 128 and 256 thresholds.
### Key Observations
* PRAC-4 consistently shows the highest speedup across all thresholds.
* The difference in speedup between thresholds 64 and 128 is more pronounced than the difference between 128 and 256.
* The Geomean speedup is very close to the speedup achieved with thresholds of 128 and 256, suggesting these thresholds provide a good balance.
* The speedup for "All" is generally lower than for the individual PRAC workloads.
### Interpretation
The data suggests that increasing the threshold initially improves performance speedup, but the gains diminish beyond a certain point (around a threshold of 128). This could be due to the trade-off between reducing false positives (by increasing the threshold) and potentially missing true positives. The Geomean threshold appears to be a good compromise, providing a speedup comparable to the higher thresholds. The higher speedup observed for PRAC-4 indicates that this workload benefits the most from the threshold adjustments. The lower speedup for "All" suggests that the optimal threshold may vary depending on the specific workload, and a single threshold may not be optimal for all scenarios. The chart demonstrates the impact of threshold selection on performance speedup for different workloads, highlighting the importance of choosing an appropriate threshold based on the specific application and performance goals.