## Line Chart: Inference Latency vs. Model Size (Pythia Models)
### Overview
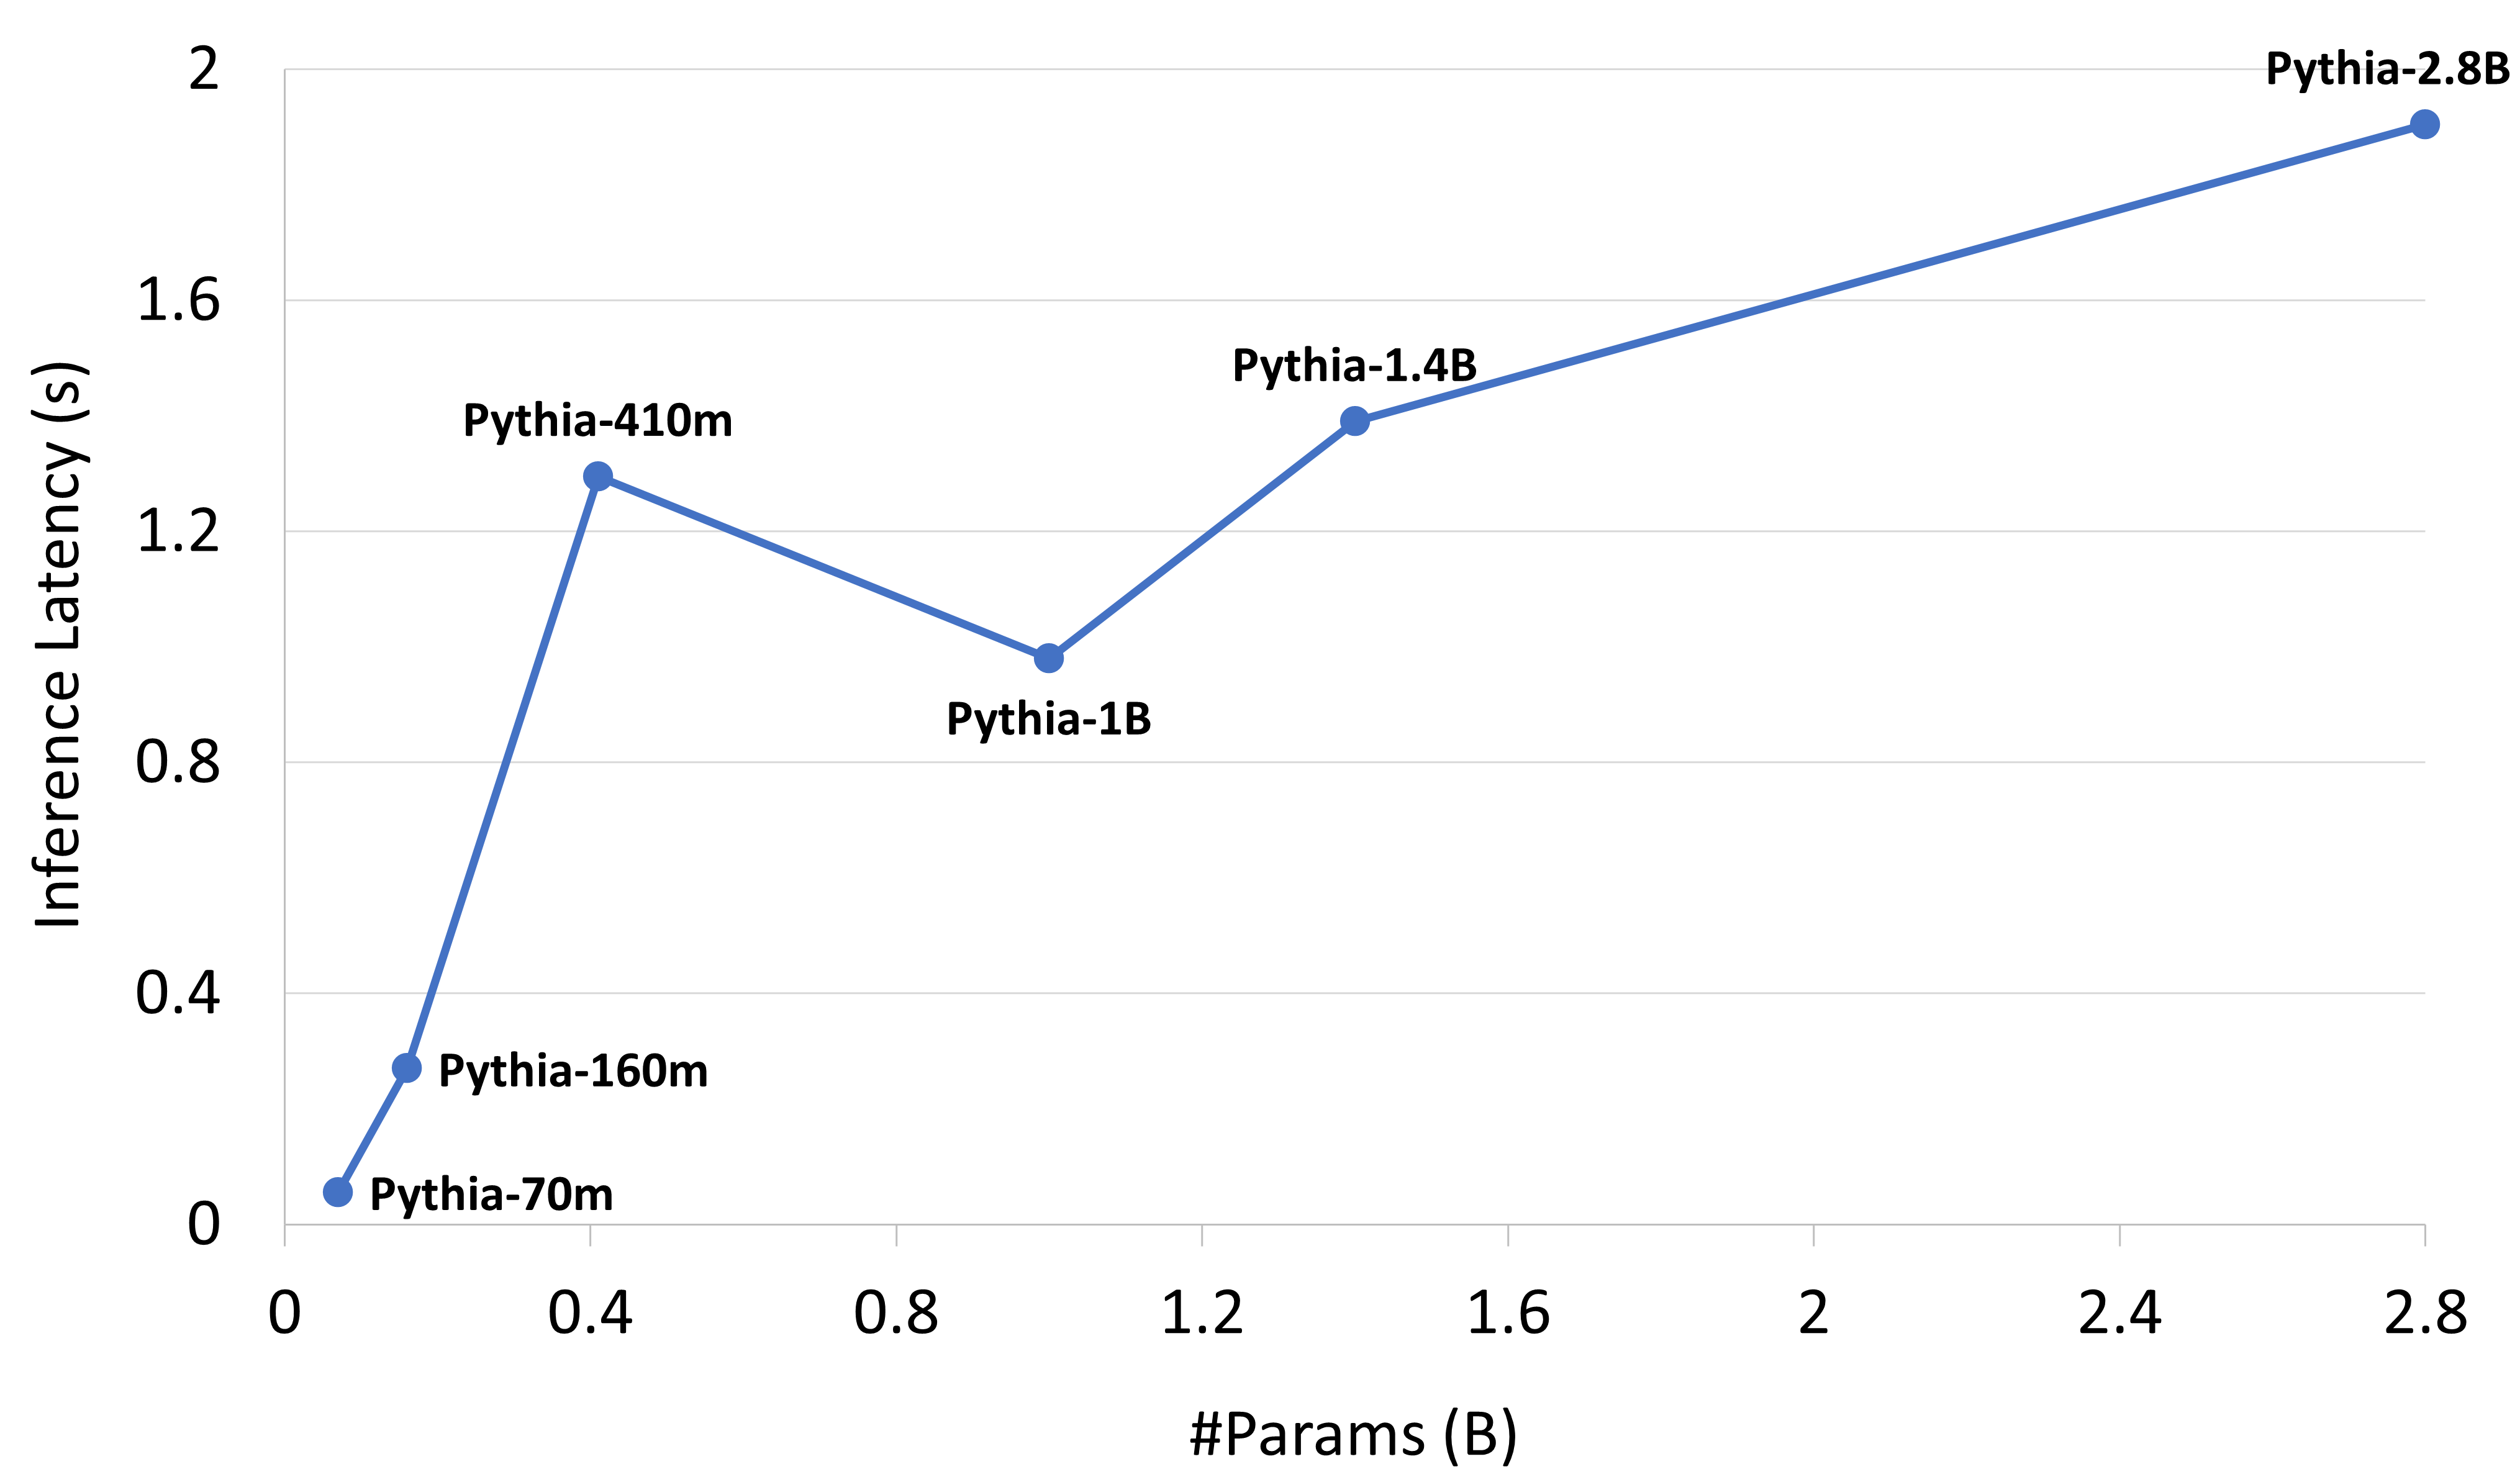
This image displays a line chart illustrating the relationship between the size of various Pythia language models (measured in billions of parameters) and their corresponding inference latency (measured in seconds). The chart plots six distinct data points connected by a line, showing non-linear performance characteristics.
### Components/Axes
* **X-Axis:** Labeled "#Params (B)" (Number of Parameters in Billions). The scale ranges from 0 to 2.8, with major grid lines at intervals of 0.4.
* **Y-Axis:** Labeled "Inference Latency (s)" (Seconds). The scale ranges from 0 to 2.0, with major grid lines at intervals of 0.4.
* **Data Series:** A single blue line connecting six data points, each labeled with the specific Pythia model name.
### Detailed Analysis
The data points are plotted as follows (approximate values based on visual estimation):
| Model Name | X-Axis (#Params in B) | Y-Axis (Latency in s) | Trend Description |
| :--- | :--- | :--- | :--- |
| **Pythia-70m** | ~0.07 | ~0.06 | Starting point, near origin. |
| **Pythia-160m** | ~0.16 | ~0.28 | Upward slope from 70m. |
| **Pythia-410m** | ~0.41 | ~1.30 | Sharp upward spike from 160m. |
| **Pythia-1B** | ~1.00 | ~0.98 | Significant downward dip from 410m. |
| **Pythia-1.4B** | ~1.40 | ~1.40 | Upward slope from 1B. |
| **Pythia-2.8B** | ~2.80 | ~1.90 | Upward slope from 1.4B to the maximum value. |
**Trend Verification:**
1. **0.07B to 0.41B:** The line exhibits a steep positive slope, indicating a rapid increase in latency as model size increases in this range.
2. **0.41B to 1.0B:** The line exhibits a sharp negative slope (a dip), indicating that the 1B model has lower inference latency than the 410m model.
3. **1.0B to 2.8B:** The line exhibits a positive slope, indicating that latency increases as model size increases beyond 1B, though the rate of increase appears less steep than the initial jump from 160m to 410m.
### Key Observations
* **Non-Linearity:** Inference latency does not scale linearly with the number of parameters.
* **The 410m Anomaly:** The Pythia-410m model represents a significant outlier. It has a higher inference latency (~1.3s) than the larger Pythia-1B model (~0.98s).
* **Scaling:** After the 1B mark, the latency increases steadily as the model size increases to 1.4B and 2.8B.
### Interpretation
The data suggests that inference latency is not strictly a function of parameter count. The significant dip in latency at the 1B parameter mark compared to the 410m mark is counter-intuitive if one assumes that larger models are always slower.
**Potential Explanations:**
* **Architectural Differences:** The Pythia-410m model may have a different architecture (e.g., different number of layers, attention heads, or hidden dimension sizes) that is less optimized for the specific hardware used for testing compared to the 1B model.
* **Hardware/Software Optimization:** The 1B model might benefit from specific hardware optimizations (e.g., tensor core utilization, memory alignment) that the 410m model does not trigger.
* **Measurement Artifacts:** It is possible that the latency measurement for the 410m model was taken under different conditions or that the model's specific configuration causes a bottleneck that is resolved in the 1B architecture.
This chart serves as a warning against assuming that smaller models are universally faster than larger models in all deployment scenarios.