# Technical Data Extraction: Principal Component Analysis (PCA) of Experts
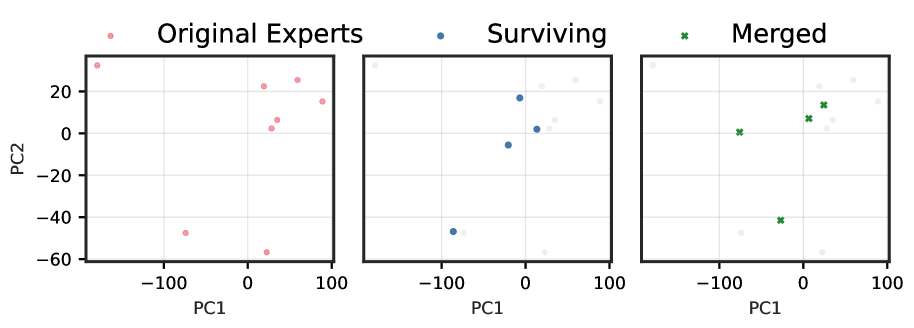
This image consists of three side-by-side scatter plots representing a Principal Component Analysis (PCA) of "Experts" in a high-dimensional space, likely related to Mixture-of-Experts (MoE) model pruning or merging.
## General Chart Configuration
- **X-Axis:** PC1 (Principal Component 1). Scale ranges from approximately -180 to 100.
- **Y-Axis:** PC2 (Principal Component 2). Scale ranges from -60 to 40.
- **Grid:** Light gray grid lines are present at intervals of 100 units on the X-axis and 20 units on the Y-axis.
- **Layout:** Three panels showing the evolution of expert states: "Original Experts," "Surviving," and "Merged."
---
## 1. Original Experts (Left Panel)
This panel shows the initial distribution of all experts.
- **Legend/Label:** Original Experts (represented by light red/pink circles).
- **Data Points:** There are 10 distinct points.
- **Cluster A (Top Right):** 6 points located roughly between PC1 [20, 90] and PC2 [0, 30].
- **Cluster B (Bottom Right):** 1 point located at approximately PC1 [25], PC2 [-58].
- **Cluster C (Bottom Left):** 1 point located at approximately PC1 [-75], PC2 [-48].
- **Cluster D (Top Left):** 2 points located at approximately PC1 [-160 to -170], PC2 [30 to 40].
## 2. Surviving (Middle Panel)
This panel highlights which of the original experts were retained (survived) without being merged.
- **Legend/Label:** Surviving (represented by blue circles).
- **Context:** The original points are shown in a faded light gray background.
- **Data Points:** 4 points are highlighted in blue.
- 1 point at PC1 [-85], PC2 [-48].
- 1 point at PC1 [-20], PC2 [-5].
- 1 point at PC1 [-5], PC2 [18].
- 1 point at PC1 [15], PC2 [2].
## 3. Merged (Right Panel)
This panel shows the result of merging experts.
- **Legend/Label:** Merged (represented by green 'x' markers).
- **Context:** The original points are shown in a faded light gray background.
- **Data Points:** 4 points are highlighted with green 'x' markers, representing the new positions of merged expert entities.
- 1 point at PC1 [-75], PC2 [1].
- 1 point at PC1 [-25], PC2 [-42].
- 1 point at PC1 [10], PC2 [8].
- 1 point at PC1 [25], PC2 [15].
---
## Summary of Data Trends
1. **Dimensionality Reduction:** The visualization uses PCA to project expert parameters into a 2D space to observe their relationships.
2. **Sparsification/Consolidation:** The process moves from 10 "Original Experts" to a combination of "Surviving" and "Merged" entities.
3. **Spatial Shift:** The "Merged" experts (green 'x') appear to be positioned at centroids or intermediate locations relative to the original clusters, particularly visible in the top-right and bottom-left regions of the plot.