## Principal Component Analysis (PCA) of Expert Data
### Overview
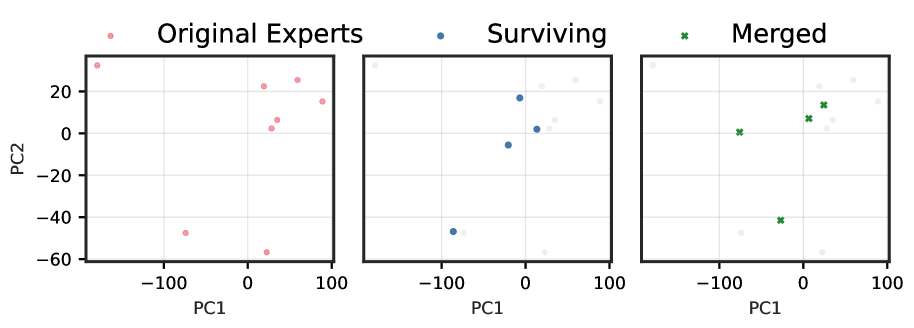
The image displays a Principal Component Analysis (PCA) plot, which is a dimensionality reduction technique used to visualize high-dimensional data in a lower-dimensional space. The plot is divided into three sections, each representing a different group of experts: Original Experts, Surviving, and Merged.
### Components/Axes
- **X-axis (PC1)**: Represents the first principal component, which captures the most variance in the data.
- **Y-axis (PC2)**: Represents the second principal component, which captures the second most variance in the data.
- **Legend**: The legend indicates the color coding for each group of experts.
- **Original Experts**: Red dots
- **Surviving**: Blue dots
- **Merged**: Green crosses
### Detailed Analysis or ### Content Details
- **Original Experts**: The red dots are scattered across the plot, indicating a wide range of values for PC1 and PC2. There is no clear clustering or pattern.
- **Surviving**: The blue dots are more concentrated towards the upper right quadrant of the plot, suggesting that these experts have higher values for both PC1 and PC2.
- **Merged**: The green crosses are also scattered, but they are more towards the lower left quadrant, indicating lower values for both PC1 and PC2.
### Key Observations
- **Original Experts**: No clear trend or pattern, suggesting that the original experts have diverse characteristics.
- **Surviving**: The concentration of blue dots in the upper right quadrant suggests that these experts have similar characteristics, possibly indicating a commonality or a group.
- **Merged**: The green crosses in the lower left quadrant suggest that the merged group has different characteristics compared to the original and surviving groups.
### Interpretation
The PCA plot suggests that the original experts have a wide range of characteristics, while the surviving and merged groups have more similar characteristics. The surviving group is more concentrated, indicating a commonality or a group, while the merged group has different characteristics. This could imply that the merging process has resulted in a group with distinct characteristics, possibly due to the merging of different expert groups with varying characteristics.