TECHNICAL ASSET FINGERPRINT
4a0293af48209c1a2bddf180
Click to view fullscreen
Press ESC or click to close
FOUND IN PAPERS
EXPERT: healer-alpha-free VERSION 1
RUNTIME: free/openrouter/healer-alpha
INTEL_VERIFIED
## Histogram Grid: Comparison of Continuous CoT vs Default Compute
### Overview
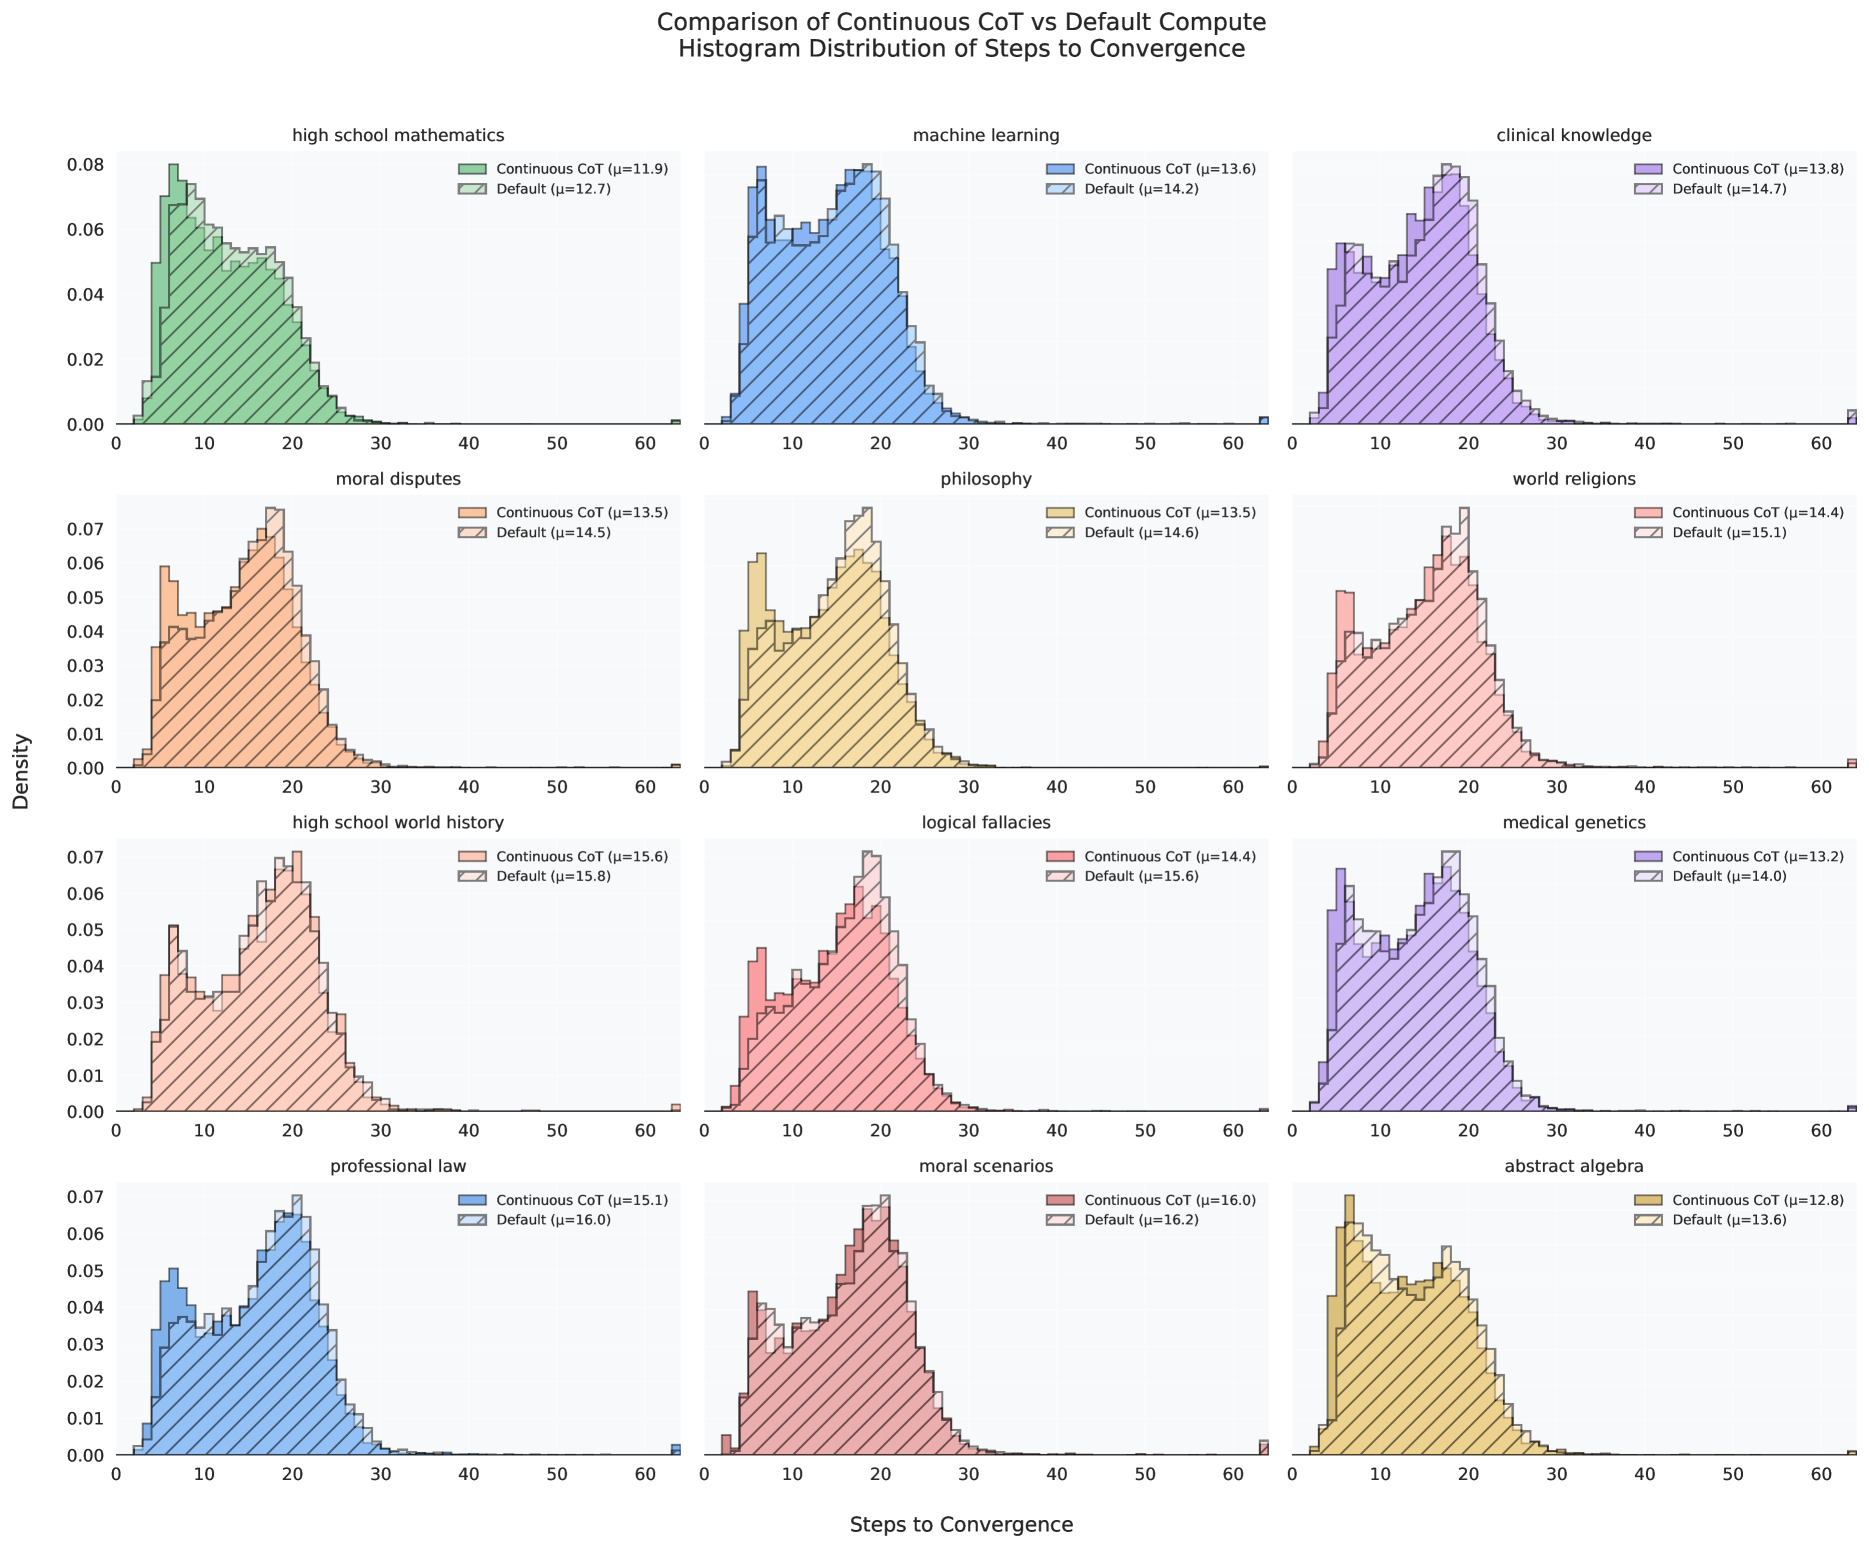
The image displays a 4x3 grid of 12 histogram plots. Each plot compares the distribution of "Steps to Convergence" for two computational methods—"Continuous CoT" (Chain-of-Thought) and "Default"—across different academic and knowledge domains. The overall title is "Comparison of Continuous CoT vs Default Compute" with a subtitle "Histogram Distribution of Steps to Convergence." The visualization aims to show how the number of steps required for a model to converge on an answer differs between the two methods across various subjects.
### Components/Axes
* **Overall Layout:** A grid of 12 subplots arranged in 4 rows and 3 columns.
* **X-Axis (Common to all plots):** Labeled "Steps to Convergence" at the bottom of the grid. The scale runs from 0 to 60, with major ticks at 0, 10, 20, 30, 40, 50, and 60.
* **Y-Axis (Common label, varying scales):** Labeled "Density" on the left side of the grid. The scale represents probability density.
* Row 1 (top): Scale from 0.00 to 0.08.
* Rows 2, 3, and 4: Scale from 0.00 to 0.07.
* **Legends:** Each subplot contains a legend in its top-right corner. The legend identifies two data series:
1. **Continuous CoT:** Represented by a solid-colored histogram bar. The legend includes the mean (μ) value for this distribution.
2. **Default:** Represented by a hatched (diagonal lines) histogram bar of a similar but slightly different shade. The legend includes the mean (μ) value for this distribution.
* **Subplot Titles:** Each subplot has a title at its top center, indicating the subject domain.
### Detailed Analysis
Below is a breakdown of each subplot, listed in order from left to right, top to bottom.
**Row 1:**
1. **Subject: high school mathematics**
* **Color Scheme:** Green.
* **Continuous CoT (μ=11.9):** Distribution peaks sharply between 5-10 steps, with a long tail extending to ~30 steps.
* **Default (μ=12.7):** Distribution is slightly broader and shifted right compared to Continuous CoT, peaking around 10 steps.
* **Trend:** Continuous CoT shows a lower mean and a distribution concentrated at lower step counts.
2. **Subject: machine learning**
* **Color Scheme:** Blue.
* **Continuous CoT (μ=13.6):** Distribution is broad, peaking between 10-20 steps.
* **Default (μ=14.2):** Very similar shape to Continuous CoT but slightly shifted right.
* **Trend:** Minimal difference between methods; both have similar spread and central tendency.
3. **Subject: clinical knowledge**
* **Color Scheme:** Purple.
* **Continuous CoT (μ=13.8):** Distribution peaks around 15 steps.
* **Default (μ=14.7):** Distribution is similar but shifted slightly to the right.
* **Trend:** Continuous CoT has a modestly lower mean.
**Row 2:**
4. **Subject: moral disputes**
* **Color Scheme:** Orange.
* **Continuous CoT (μ=13.5):** Distribution is bimodal, with a smaller peak near 5 steps and a larger peak around 15-20 steps.
* **Default (μ=14.5):** Similar bimodal shape but the main peak is slightly right-shifted.
* **Trend:** Continuous CoT reduces the mean steps, particularly affecting the main cluster of the distribution.
5. **Subject: philosophy**
* **Color Scheme:** Yellow/Ochre.
* **Continuous CoT (μ=13.5):** Distribution is broad and somewhat flat-topped between 10-20 steps.
* **Default (μ=14.6):** Similar broad shape, shifted right.
* **Trend:** Continuous CoT provides a consistent, moderate reduction in steps.
6. **Subject: world religions**
* **Color Scheme:** Pink/Salmon.
* **Continuous CoT (μ=14.4):** Distribution peaks around 15-20 steps.
* **Default (μ=15.1):** Distribution is similar but shifted right.
* **Trend:** Small but consistent reduction in mean steps with Continuous CoT.
**Row 3:**
7. **Subject: high school world history**
* **Color Scheme:** Light Red.
* **Continuous CoT (μ=15.6):** Distribution is broad, peaking around 20 steps.
* **Default (μ=15.8):** Nearly identical distribution to Continuous CoT.
* **Trend:** Almost no discernible difference between the two methods for this subject.
8. **Subject: logical fallacies**
* **Color Scheme:** Red.
* **Continuous CoT (μ=14.4):** Distribution peaks around 15 steps.
* **Default (μ=15.6):** Distribution is shifted right, with a peak closer to 20 steps.
* **Trend:** Continuous CoT shows a clear reduction in the number of steps needed.
9. **Subject: medical genetics**
* **Color Scheme:** Lavender.
* **Continuous CoT (μ=13.2):** Distribution is broad, peaking between 10-20 steps.
* **Default (μ=14.0):** Similar shape, shifted right.
* **Trend:** Continuous CoT offers a moderate improvement.
**Row 4:**
10. **Subject: professional law**
* **Color Scheme:** Steel Blue.
* **Continuous CoT (μ=15.1):** Distribution is broad, peaking around 20 steps.
* **Default (μ=16.0):** Distribution is shifted right, with a peak slightly past 20 steps.
* **Trend:** Continuous CoT reduces the mean steps.
11. **Subject: moral scenarios**
* **Color Scheme:** Dark Pink.
* **Continuous CoT (μ=16.0):** Distribution peaks around 20 steps.
* **Default (μ=16.2):** Nearly identical distribution to Continuous CoT.
* **Trend:** Very minimal difference between methods.
12. **Subject: abstract algebra**
* **Color Scheme:** Gold.
* **Continuous CoT (μ=12.8):** Distribution is broad, peaking between 10-20 steps.
* **Default (μ=13.6):** Similar shape, shifted right.
* **Trend:** Continuous CoT provides a moderate reduction in steps.
### Key Observations
1. **Consistent Pattern:** In 11 out of 12 subjects, the "Continuous CoT" method has a lower mean (μ) number of steps to convergence than the "Default" method. The only near-exception is "high school world history," where the means are almost equal (15.6 vs 15.8).
2. **Magnitude of Improvement:** The reduction in mean steps varies by subject. The largest observed difference is in "logical fallacies" (Δμ = 1.2 steps). The smallest non-zero difference is in "moral scenarios" (Δμ = 0.2 steps).
3. **Distribution Shape:** All distributions are right-skewed, indicating that while most problems converge within 10-25 steps, a long tail of problems requires significantly more steps (up to 60).
4. **Visual Confirmation:** In every plot, the solid-colored histogram (Continuous CoT) is visually shifted to the left relative to the hatched histogram (Default), corroborating the lower mean values listed in the legends.
### Interpretation
This data suggests that employing a "Continuous Chain-of-Thought" (CoT) reasoning method generally leads to more efficient problem-solving, requiring fewer computational steps to reach a convergent answer compared to a "Default" method. The benefit is domain-dependent, showing clear gains in subjects like logical fallacies, mathematics, and law, while being negligible in areas like world history and moral scenarios.
The right-skewed nature of all distributions is a critical finding. It implies that problem difficulty (as measured by steps to convergence) is not normally distributed; a subset of problems is inherently more complex and computationally expensive, regardless of the method used. The primary effect of Continuous CoT appears to be shifting the central mass of the distribution leftward, making the "typical" problem easier to solve, but it does not eliminate the long tail of difficult problems.
From a systems perspective, adopting Continuous CoT could lead to meaningful reductions in average computational cost and latency across a wide range of tasks. However, the variability in improvement highlights the importance of domain-specific evaluation when implementing such techniques. The near-identical results in some domains may indicate that the Default method is already near-optimal for those problem types, or that the Continuous CoT approach does not align well with the reasoning patterns required.
DECODING INTELLIGENCE...