## Bar Chart: R1-Llama | AMC23
### Overview
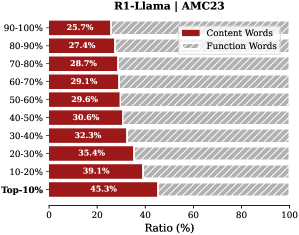
The image is a horizontal bar chart comparing the ratio (%) of "Content Words" and "Function Words" across different percentile ranges (Top-10% to 90-100%) for R1-Llama | AMC23. The chart shows how the proportion of content words changes as we move from the top percentile to the lower percentiles.
### Components/Axes
* **Title:** R1-Llama | AMC23
* **Y-axis (Vertical):** Percentile ranges (Top-10%, 10-20%, 20-30%, 30-40%, 40-50%, 50-60%, 60-70%, 70-80%, 80-90%, 90-100%)
* **X-axis (Horizontal):** Ratio (%) from 0 to 100
* **Legend (Top-Right):**
* Content Words (Dark Red)
* Function Words (Light Gray with diagonal stripes)
### Detailed Analysis
The chart displays the ratio of content words in dark red and function words in light gray with diagonal stripes for each percentile range.
* **Top-10%:** Content Words: 45.3%, Function Words: approximately 54.7%
* **10-20%:** Content Words: 39.1%, Function Words: approximately 60.9%
* **20-30%:** Content Words: 35.4%, Function Words: approximately 64.6%
* **30-40%:** Content Words: 32.3%, Function Words: approximately 67.7%
* **40-50%:** Content Words: 30.6%, Function Words: approximately 69.4%
* **50-60%:** Content Words: 29.6%, Function Words: approximately 70.4%
* **60-70%:** Content Words: 29.1%, Function Words: approximately 70.9%
* **70-80%:** Content Words: 28.7%, Function Words: approximately 71.3%
* **80-90%:** Content Words: 27.4%, Function Words: approximately 72.6%
* **90-100%:** Content Words: 25.7%, Function Words: approximately 74.3%
### Key Observations
* The proportion of content words decreases as the percentile range decreases (from Top-10% to 90-100%).
* The proportion of function words increases as the percentile range decreases.
* The Top-10% percentile has the highest ratio of content words (45.3%).
* The 90-100% percentile has the lowest ratio of content words (25.7%).
### Interpretation
The data suggests that the "Top-10%" percentile contains a higher proportion of content words compared to the other percentile ranges. This indicates that the text generated or analyzed in the top percentile is more focused on conveying specific information or meaning, while the lower percentiles rely more on function words, which serve grammatical purposes. The trend demonstrates that as we move away from the top percentile, the content becomes less dense and more reliant on structural words. This could imply that the quality or informativeness of the text decreases as we move down the percentile ranges.