\n
## Horizontal Bar Chart: R1-Llama | AMC23
### Overview
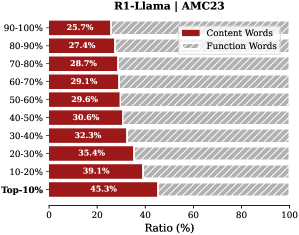
The image displays a horizontal stacked bar chart titled "R1-Llama | AMC23". It visualizes the percentage ratio of "Content Words" versus "Function Words" across ten decile-based categories, ranging from the "Top-10%" to the "90-100%" group. The chart suggests an analysis of linguistic composition within a dataset or model output, likely related to the AMC23 benchmark.
### Components/Axes
* **Chart Title:** "R1-Llama | AMC23" (centered at the top).
* **Y-Axis (Vertical):** Lists ten categorical decile ranges. From top to bottom:
* 90-100%
* 80-90%
* 70-80%
* 60-70%
* 50-60%
* 40-50%
* 30-40%
* 20-30%
* 10-20%
* Top-10%
* **X-Axis (Horizontal):** Labeled "Ratio (%)". The scale runs from 0 to 100 with major tick marks at 0, 20, 40, 60, 80, and 100.
* **Legend:** Positioned in the top-right corner of the chart area.
* A solid red rectangle is labeled "Content Words".
* A red rectangle with diagonal hatching (stripes) is labeled "Function Words".
* **Data Series:** Each horizontal bar is a stacked combination of the two series. The solid red segment ("Content Words") is on the left, and the hatched red segment ("Function Words") is on the right. The total length of each bar sums to 100%.
### Detailed Analysis
The chart presents the following data points for each decile category. The values are read directly from the percentage labels on each bar segment.
| Decile Category | Content Words (Solid Red) | Function Words (Hatched Red) |
| :--- | :--- | :--- |
| **90-100%** | 25.7% | 74.3% |
| **80-90%** | 27.4% | 72.6% |
| **70-80%** | 28.7% | 71.3% |
| **60-70%** | 29.1% | 70.9% |
| **50-60%** | 29.6% | 70.4% |
| **40-50%** | 30.6% | 69.4% |
| **30-40%** | 32.3% | 67.7% |
| **20-30%** | 35.4% | 64.6% |
| **10-20%** | 39.1% | 60.9% |
| **Top-10%** | 45.3% | 54.7% |
**Trend Verification:**
* **Content Words (Solid Red):** The line formed by the right edge of the solid red bars slopes **downward** from left to right as you move from the "Top-10%" category at the bottom to the "90-100%" category at the top. This indicates a **decreasing trend** in the ratio of content words as the decile percentile increases.
* **Function Words (Hatched Red):** Conversely, the line formed by the right edge of the entire bar (which is the left edge of the function words segment) slopes **upward** from left to right from bottom to top. This indicates an **increasing trend** in the ratio of function words as the decile percentile increases.
### Key Observations
1. **Inverse Relationship:** There is a clear, consistent inverse relationship between the two word categories. As the percentage of Content Words decreases across deciles, the percentage of Function Words increases by a corresponding amount.
2. **Maximum and Minimum:** The highest ratio of Content Words (45.3%) is found in the "Top-10%" category. The lowest ratio of Content Words (25.7%) is in the "90-100%" category.
3. **Dominance of Function Words:** In every single decile category, Function Words constitute the majority (over 50%) of the ratio. Their dominance increases from 54.7% in the "Top-10%" to 74.3% in the "90-100%".
4. **Non-Linear Progression:** The change between consecutive deciles is not perfectly uniform. The largest single jump in Content Words ratio occurs between the "10-20%" (39.1%) and "Top-10%" (45.3%) categories, a difference of 6.2 percentage points.
### Interpretation
This chart likely analyzes the linguistic properties of text generated by or associated with the "R1-Llama" model on the "AMC23" benchmark. The deciles ("Top-10%", "90-100%", etc.) probably rank samples based on a performance metric (e.g., accuracy, score), with "Top-10%" being the best-performing group.
The data suggests a strong correlation between performance and lexical composition:
* **Higher-performing samples (Top-10%, 10-20%)** use a significantly higher proportion of **Content Words** (nouns, verbs, adjectives, adverbs) which carry semantic meaning. This implies these responses are more information-dense, specific, and substantive.
* **Lower-performing samples (80-90%, 90-100%)** are dominated by **Function Words** (prepositions, articles, conjunctions, pronouns) which serve grammatical roles. This could indicate responses that are more verbose, structurally complex but semantically vague, or reliant on formulaic language without deep content.
The trend implies that for this task, the quality or effectiveness of output (as measured by the AMC23 benchmark) is closely tied to the density of meaningful, content-bearing vocabulary. The "Top-10%" responses are nearly twice as dense in content words (45.3%) as the "90-100%" responses (25.7%). This insight could be used to guide model fine-tuning or evaluation, emphasizing the generation of substantive content over purely grammatical but hollow phrasing.