## [Comparison Chart]: FLoD-3DGS vs. FLoD-Scaffold Detail Levels and Memory Usage
### Overview
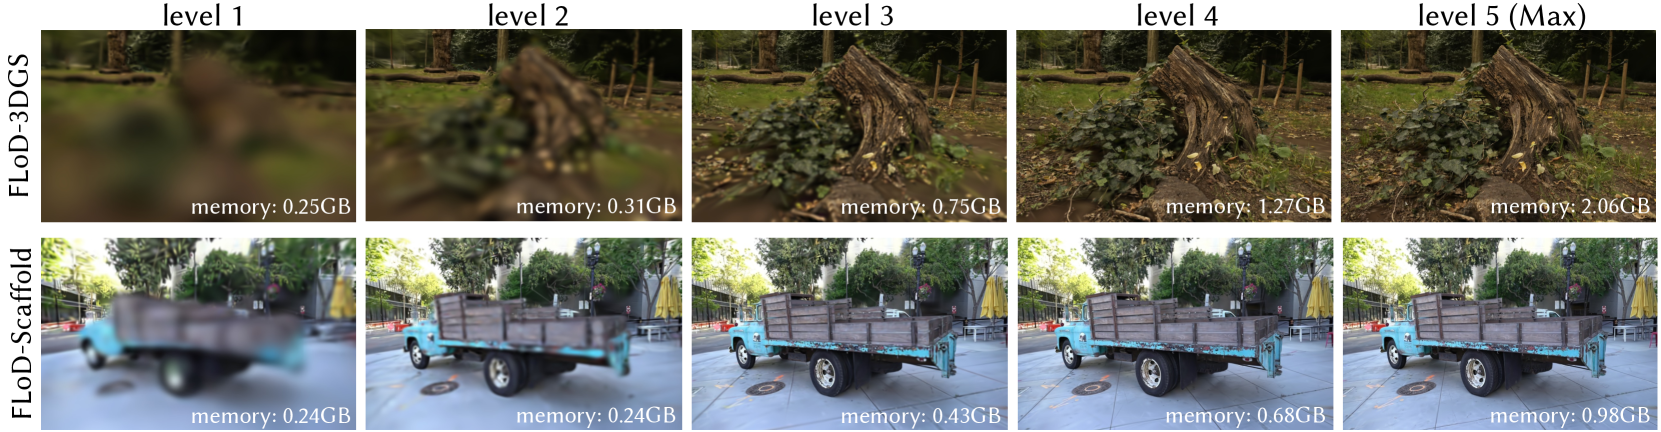
The image is a technical comparison chart displaying the visual quality and memory consumption of two different methods, labeled "FLoD-3DGS" and "FLoD-Scaffold," across five progressive levels of detail (LOD). The chart is structured as a 2x5 grid. The top row shows results for FLoD-3DGS, and the bottom row for FLoD-Scaffold. Each column corresponds to a detail level, from "level 1" (lowest detail) to "level 5 (Max)" (highest detail). For each method and level, a representative rendered image is shown, with the associated memory usage (in GB) annotated in the bottom-right corner of the image.
### Components/Axes
* **Row Labels (Left Side):** Two methods are compared, listed vertically on the far left.
* Top Row: `FLoD-3DGS`
* Bottom Row: `FLoD-Scaffold`
* **Column Headers (Top):** Five levels of detail are defined across the top.
* Column 1: `level 1`
* Column 2: `level 2`
* Column 3: `level 3`
* Column 4: `level 4`
* Column 5: `level 5 (Max)`
* **Data Annotations (Within each cell):** Each of the 10 image cells contains a memory usage value in the bottom-right corner, formatted as `memory: X.XXGB`.
### Detailed Analysis
**Visual Quality Trend:** For both methods, moving from left (level 1) to right (level 5) shows a clear and significant increase in image sharpness, detail, and visual fidelity. Level 1 images are heavily blurred, while level 5 images are sharp and clear.
**Memory Usage Data Points:**
* **FLoD-3DGS (Top Row):**
* Level 1: `memory: 0.25GB`
* Level 2: `memory: 0.31GB`
* Level 3: `memory: 0.75GB`
* Level 4: `memory: 1.27GB`
* Level 5 (Max): `memory: 2.06GB`
* **Trend:** Memory usage increases monotonically and non-linearly with detail level. The jump from level 4 to 5 is the largest absolute increase (+0.79GB).
* **FLoD-Scaffold (Bottom Row):**
* Level 1: `memory: 0.24GB`
* Level 2: `memory: 0.24GB`
* Level 3: `memory: 0.43GB`
* Level 4: `memory: 0.68GB`
* Level 5 (Max): `memory: 0.98GB`
* **Trend:** Memory usage also increases with detail level, but the growth is more gradual. Notably, levels 1 and 2 have identical memory usage (0.24GB). The increase from level 4 to 5 (+0.30GB) is smaller than for FLoD-3DGS.
### Key Observations
1. **Efficiency Divergence:** While both methods start at similar memory footprints at level 1 (~0.24-0.25GB), their memory consumption diverges significantly at higher detail levels. At level 5 (Max), FLoD-3DGS (2.06GB) uses more than double the memory of FLoD-Scaffold (0.98GB).
2. **Visual Quality vs. Memory Trade-off:** The chart visually demonstrates the trade-off between rendering quality and resource cost. Achieving the maximum visual fidelity (level 5) comes at a substantial memory cost, especially for the FLoD-3DGS method.
3. **Plateau in Scaffold:** The FLoD-Scaffold method shows no increase in memory between level 1 and level 2, suggesting a potential optimization or a different scaling behavior at the lowest detail tiers.
### Interpretation
This chart is likely from a research paper or technical report on Level-of-Detail (LOD) management for 3D rendering, possibly in the context of Neural Radiance Fields (NeRF) or Gaussian Splatting, given the "3DGS" acronym. It serves to **benchmark and compare the memory efficiency** of two proposed techniques (FLoD-3DGS and FLoD-Scaffold) as they scale visual quality.
The data suggests that **FLoD-Scaffold is a more memory-efficient method for achieving high-detail rendering**. For applications where memory is a constrained resource (e.g., mobile devices, real-time applications with many assets), FLoD-Scaffold would be the preferable choice to reach higher visual fidelity without the steep memory penalty seen in FLoD-3DGS. The chart effectively argues for the superiority of the Scaffold approach in terms of resource scaling. The identical memory usage for Scaffold at levels 1 and 2 might indicate a fixed overhead or a different strategy for handling the coarsest levels of detail.