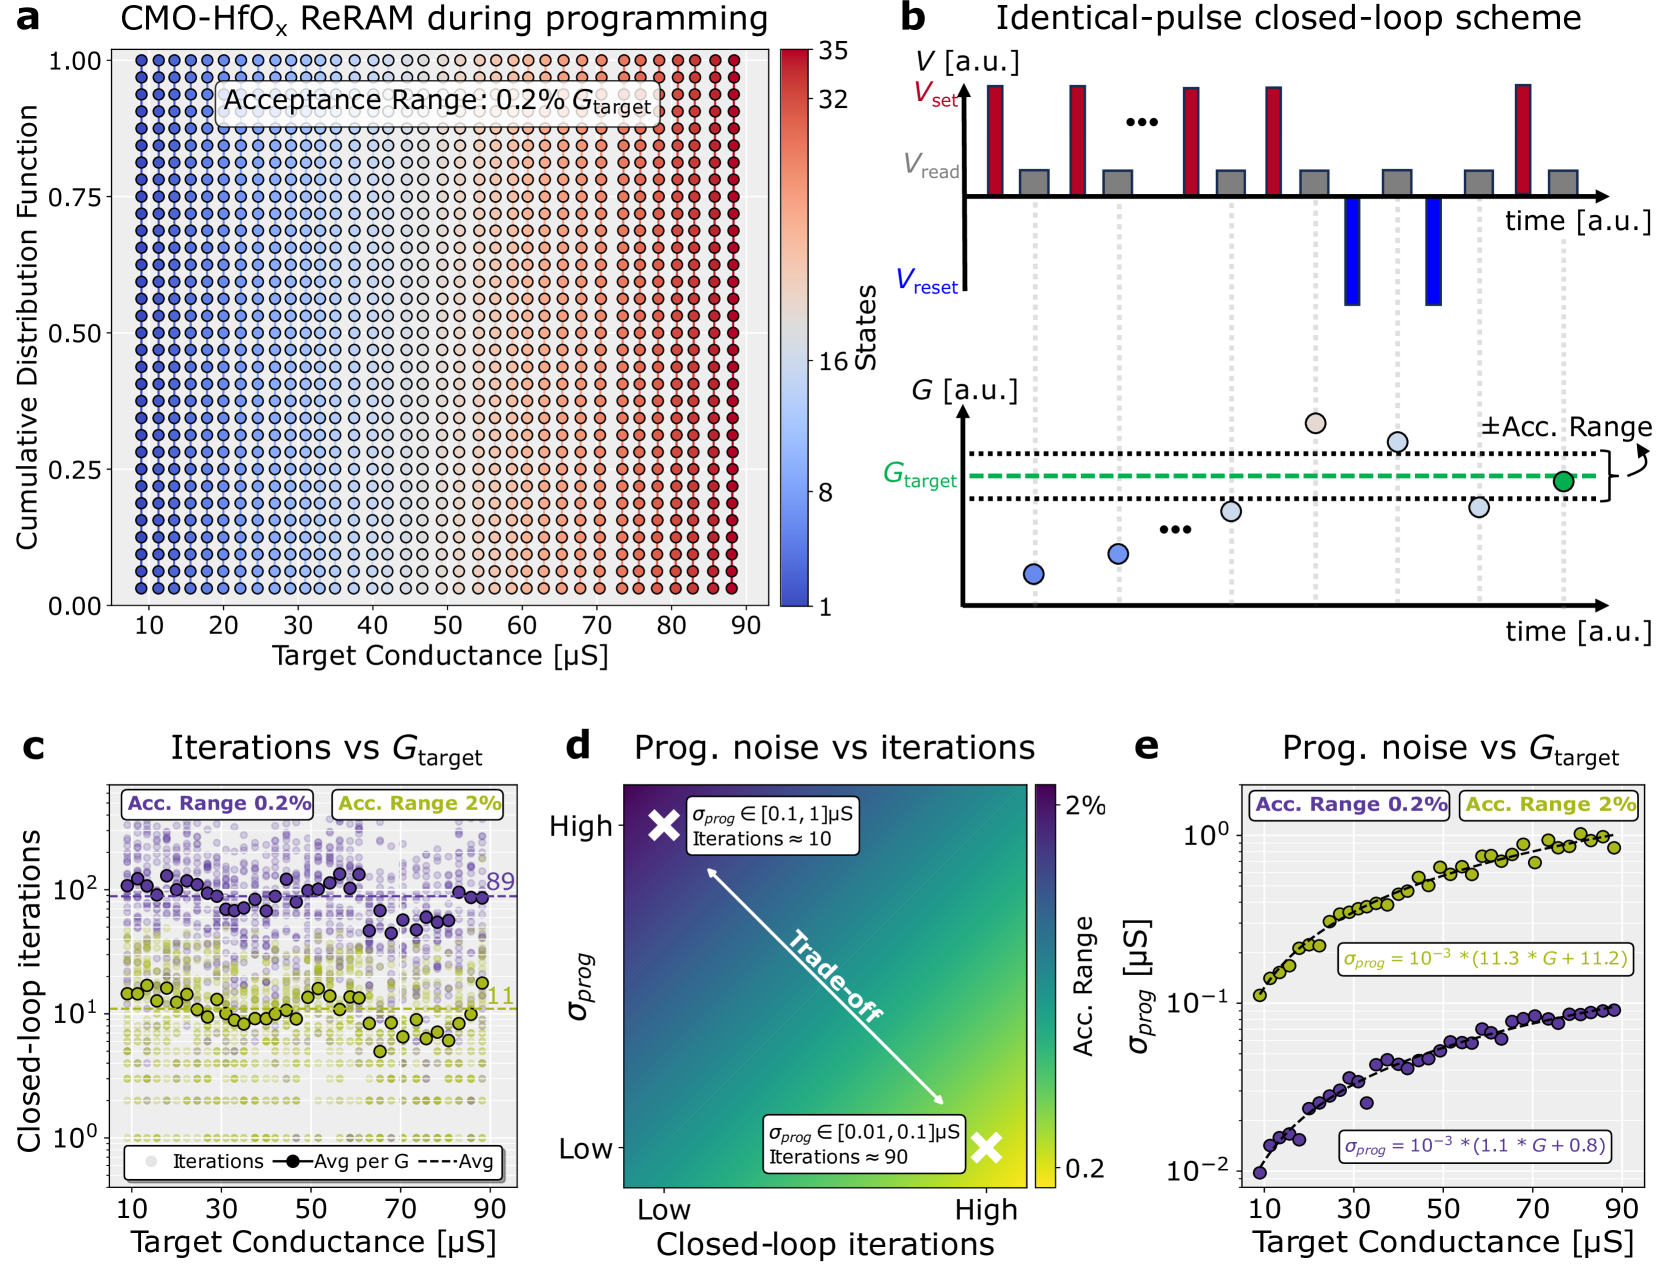
## Heatmap: CMO-HfOₓ ReRAM during programming
### Overview
A heatmap visualizing the cumulative distribution function (CDF) of target conductance values during ReRAM programming. The color gradient represents the density of data points, with blue indicating lower values and red higher values.
### Components/Axes
- **X-axis**: Target Conductance [μS] (10–90 μS)
- **Y-axis**: Cumulative Distribution Function (0.00–1.00)
- **Color Scale**: Blue (low density) to Red (high density)
- **Legend**: "Acceptance Range: 0.2% G_target" (annotated in the top-left region)
### Detailed Analysis
- The heatmap shows a gradient from blue (left) to red (right), indicating increasing conductance values.
- The acceptance range (0.2% G_target) is highlighted in the upper-left quadrant, where data points cluster densely.
- No explicit numerical values are provided, but the color intensity suggests higher conductance values (e.g., >70 μS) dominate the red regions.
### Key Observations
- Conductance values below 30 μS are underrepresented (blue regions).
- The acceptance range annotation implies a focus on conductance values near the target threshold.
### Interpretation
The heatmap demonstrates the distribution of target conductance during ReRAM programming, with a concentration of data points near the 0.2% acceptance range. This suggests variability in programming outcomes, particularly at lower conductance values.
---
## Diagram: Identical-pulse closed-loop scheme
### Overview
A schematic of a closed-loop programming process for ReRAM, showing voltage pulses and conductance measurements over time.
### Components/Axes
- **X-axis**: Time [a.u.] (sequential steps)
- **Y-axis**: Voltage States (V_set, V_read, V_reset) and Conductance (G)
- **Key Elements**:
- Red bars: V_set pulses
- Gray bars: V_read measurements
- Blue bars: V_reset pulses
- Green dashed line: G_target threshold
- Acceptance range: ±0.2% G_target (annotated with arrows)
### Detailed Analysis
- The process alternates between V_set (programming), V_read (measurement), and V_reset (reset).
- Conductance (G) is measured after each V_read, with deviations from G_target marked by the acceptance range.
- The green dashed line (G_target) acts as a reference for successful programming.
### Key Observations
- Conductance measurements (G) are tightly controlled within ±0.2% of G_target.
- V_set pulses are consistently applied to adjust conductance toward G_target.
### Interpretation
This closed-loop scheme ensures precise control of ReRAM conductance by iteratively adjusting voltage pulses and measuring deviations from the target. The acceptance range indicates tolerance for minor variations.
---
## Scatter Plot: Iterations vs G_target
### Overview
A log-scale plot comparing closed-loop iterations to target conductance (G_target) for two acceptance ranges (0.2% and 2%).
### Components/Axes
- **X-axis**: Target Conductance [μS] (10–90 μS)
- **Y-axis**: Closed-loop Iterations (10⁰–10²)
- **Legend**:
- Purple: Acceptance Range 0.2%
- Green: Acceptance Range 2%
- Black dashed line: Average iterations per G_target
### Detailed Analysis
- **0.2% Acceptance Range (Purple)**:
- Iterations increase with G_target, peaking at ~100 iterations for G_target ≈ 80 μS.
- Data points cluster densely between 10–50 μS.
- **2% Acceptance Range (Green)**:
- Fewer iterations required (1–10 iterations) across all G_target values.
- Data points are sparser but show a general upward trend.
### Key Observations
- Tighter acceptance ranges (0.2%) require significantly more iterations, especially at higher G_target values.
- The average iterations per G_target (black dashed line) suggests a logarithmic relationship.
### Interpretation
Higher precision (0.2% acceptance) demands more iterations, highlighting the trade-off between accuracy and computational effort in ReRAM programming.
---
## Heatmap: Prog. noise vs iterations
### Overview
A heatmap showing the relationship between programming noise (σ_prog) and closed-loop iterations, with color gradients indicating acceptance ranges.
### Components/Axes
- **X-axis**: Closed-loop Iterations (Low to High)
- **Y-axis**: Programming Noise (σ_prog) [μS]
- **Color Scale**: Blue (low σ_prog) to Yellow (high σ_prog)
- **Annotations**:
- "Trade-off: σ_prog ∈ [0.01, 0.1] μS, Iterations ≈ 90"
- "σ_prog ∈ [0.1, 1] μS, Iterations ≈ 10"
### Detailed Analysis
- Lower σ_prog (blue regions) correlates with higher iterations (right side of the plot).
- Higher σ_prog (yellow regions) aligns with fewer iterations.
- The "trade-off" annotation emphasizes the inverse relationship between noise and iterations.
### Key Observations
- σ_prog values below 0.1 μS require ~90 iterations, while values above 0.1 μS drop to ~10 iterations.
- The acceptance range is not explicitly labeled but inferred from color intensity.
### Interpretation
Reducing programming noise improves precision but increases the number of iterations needed, reflecting a critical balance in ReRAM optimization.
---
## Scatter Plot: Prog. noise vs G_target
### Overview
A log-scale plot of programming noise (σ_prog) against target conductance (G_target), with two acceptance ranges (0.2% and 2%).
### Components/Axes
- **X-axis**: Target Conductance [μS] (10–90 μS)
- **Y-axis**: Programming Noise (σ_prog) [μS] (10⁻²–10⁰)
- **Legend**:
- Purple: Acceptance Range 0.2%
- Green: Acceptance Range 2%
- **Equations**:
- σ_prog = 10⁻³*(11.3*G + 11.2) (0.2% range)
- σ_prog = 10⁻³*(1.1*G + 0.8) (2% range)
### Detailed Analysis
- **0.2% Acceptance Range (Purple)**:
- σ_prog increases linearly with G_target (slope ≈ 11.3*10⁻³).
- Data points form a tight curve from ~0.1 μS (G=10 μS) to ~1.2 μS (G=90 μS).
- **2% Acceptance Range (Green)**:
- σ_prog increases more slowly (slope ≈ 1.1*10⁻³).
- Data points range from ~0.08 μS (G=10 μS) to ~1.0 μS (G=90 μS).
### Key Observations
- Tighter acceptance ranges (0.2%) exhibit higher σ_prog, especially at higher G_target values.
- The 2% range shows a flatter trend, indicating lower noise tolerance.
### Interpretation
Programming noise scales with target conductance, with stricter acceptance ranges amplifying noise effects. This underscores the challenge of maintaining precision in high-conductance ReRAM devices.