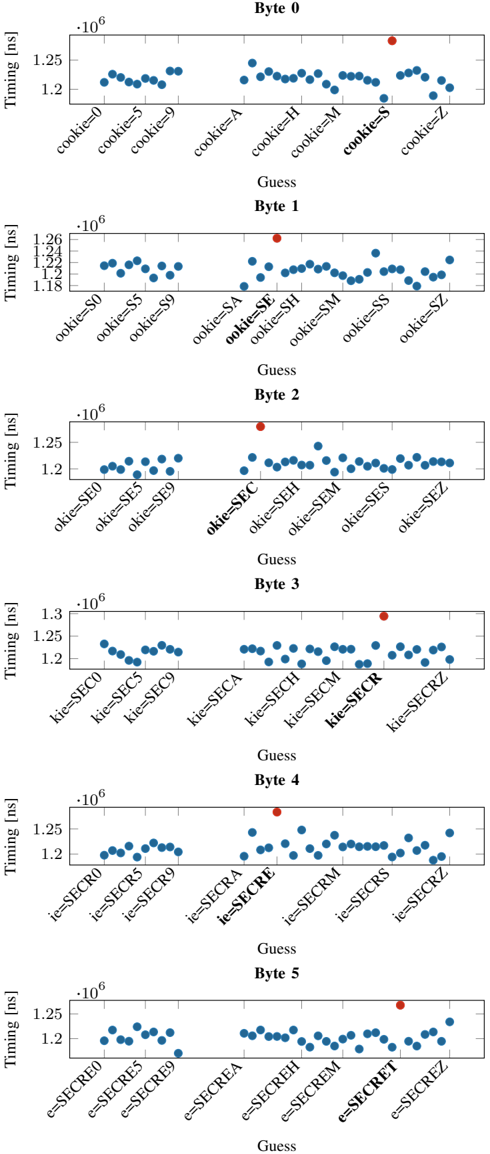
## Timing Analysis of Cookie Guessing
### Overview
The image presents six scatter plots, each representing the timing (in nanoseconds) for different guesses of a byte in a cookie. Each plot corresponds to a specific byte position (Byte 0 to Byte 5). The x-axis represents the different guesses made for that byte, and the y-axis represents the timing taken for each guess. A red dot highlights a specific guess in each byte plot, presumably indicating the correct guess.
### Components/Axes
* **Y-axis:** "Timing [ns]" with a scale from approximately 1.18 x 10^6 to 1.3 x 10^6 ns. The scale varies slightly between plots.
* **X-axis:** "Guess" - represents the different guesses made for the cookie byte. The labels on the x-axis indicate the specific guess being made (e.g., "cookie=0", "ookie=S0", "kie=SEC0", "ie=SECR0", "e=SECRE0").
* **Titles:** Each plot has a title indicating the byte number being analyzed (e.g., "Byte 0", "Byte 1", ..., "Byte 5").
* **Data Points:** Blue dots represent the timing for each guess.
* **Highlighted Guess:** A red dot highlights a specific guess in each plot.
### Detailed Analysis
**Byte 0:**
* X-axis labels: `cookie=0`, `cookie=5`, `cookie=9`, `cookie=A`, `cookie=H`, `cookie=M`, `cookie=S`, `cookie=Z`
* Y-axis range: Approximately 1.2 x 10^6 to 1.26 x 10^6 ns.
* Trend: The timing values are relatively stable, with a slight increase for `cookie=9` and `cookie=S`.
* Highlighted Guess: `cookie=S` is highlighted with a red dot.
* Values: Most points are around 1.22 x 10^6 ns, with `cookie=9` and `cookie=S` around 1.24 x 10^6 ns.
**Byte 1:**
* X-axis labels: `ookie=S0`, `ookie=S5`, `ookie=S9`, `ookie=SA`, `ookie=SE`, `ookie=SH`, `ookie=SM`, `ookie=SS`, `ookie=SZ`
* Y-axis range: Approximately 1.18 x 10^6 to 1.26 x 10^6 ns.
* Trend: The timing values are relatively stable, with a noticeable increase for `ookie=SE`.
* Highlighted Guess: `ookie=SE` is highlighted with a red dot.
* Values: Most points are around 1.22 x 10^6 ns, with `ookie=SE` around 1.26 x 10^6 ns.
**Byte 2:**
* X-axis labels: `okie=SE0`, `okie=SE5`, `okie=SE9`, `okie=SEC`, `okie=SEH`, `okie=SEM`, `okie=SES`, `okie=SEZ`
* Y-axis range: Approximately 1.19 x 10^6 to 1.27 x 10^6 ns.
* Trend: The timing values are relatively stable, with a slight increase for `okie=SEC`.
* Highlighted Guess: `okie=SEC` is highlighted with a red dot.
* Values: Most points are around 1.22 x 10^6 ns, with `okie=SEC` around 1.26 x 10^6 ns.
**Byte 3:**
* X-axis labels: `kie=SEC0`, `kie=SEC5`, `kie=SEC9`, `kie=SECA`, `kie=SECH`, `kie=SECM`, `kie=SECR`, `kie=SECRZ`
* Y-axis range: Approximately 1.2 x 10^6 to 1.3 x 10^6 ns.
* Trend: The timing values are relatively stable, with a slight increase for `kie=SECR`.
* Highlighted Guess: `kie=SECR` is highlighted with a red dot.
* Values: Points for `kie=SEC0`, `kie=SEC5`, `kie=SEC9` are around 1.22 x 10^6 ns. `kie=SECR` is around 1.28 x 10^6 ns.
**Byte 4:**
* X-axis labels: `ie=SECR0`, `ie=SECR5`, `ie=SECR9`, `ie=SECRA`, `ie=SECRE`, `ie=SECRM`, `ie=SECRS`, `ie=SECRZ`
* Y-axis range: Approximately 1.19 x 10^6 to 1.27 x 10^6 ns.
* Trend: The timing values are relatively stable, with a noticeable increase for `ie=SECRE`.
* Highlighted Guess: `ie=SECRE` is highlighted with a red dot.
* Values: Most points are around 1.22 x 10^6 ns, with `ie=SECRE` around 1.26 x 10^6 ns.
**Byte 5:**
* X-axis labels: `e=SECRE0`, `e=SECRE5`, `e=SECRE9`, `e=SECREA`, `e=SECREH`, `e=SECREM`, `e=SECRET`, `e=SECREZ`
* Y-axis range: Approximately 1.19 x 10^6 to 1.27 x 10^6 ns.
* Trend: The timing values are relatively stable, with a slight increase for `e=SECRET`.
* Highlighted Guess: `e=SECRET` is highlighted with a red dot.
* Values: Most points are around 1.22 x 10^6 ns, with `e=SECRET` around 1.26 x 10^6 ns.
### Key Observations
* For each byte, the highlighted guess (red dot) corresponds to a noticeable increase in timing compared to other guesses.
* The timing differences between correct and incorrect guesses are relatively small, on the order of 0.04 x 10^6 ns (40,000 ps).
* The x-axis labels show a progression in the guessed string as the byte position increases (e.g., `cookie`, `ookie`, `okie`, `kie`, `ie`, `e`).
### Interpretation
The data suggests a timing attack vulnerability. The correct guess for each byte of the cookie results in a slightly longer execution time. This timing difference, although small, can be exploited to infer the correct cookie value. The red dots indicate the correct cookie bytes, which, when combined, form the string "SECRET". The timing variations likely arise from conditional branches or other operations that take slightly longer when the correct byte is guessed. This type of analysis is crucial for identifying and mitigating security vulnerabilities in software systems.