## Heatmap Grid: Auditory Frequency Distribution Across Conditions
### Overview
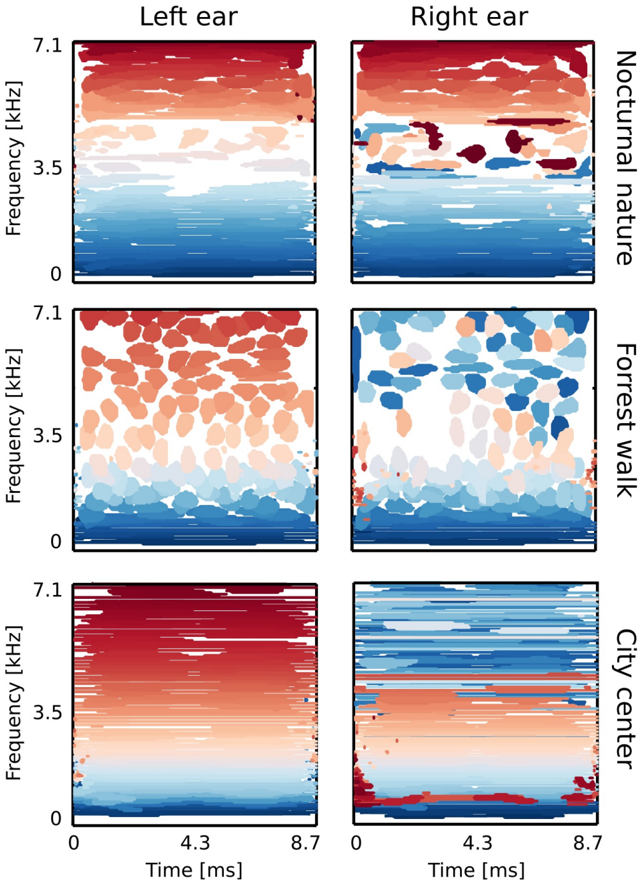
The image presents a 2x3 grid of heatmaps visualizing auditory frequency distributions across different conditions and ear types. Each heatmap uses a color gradient (blue to red) to represent intensity, with axes labeled "Frequency [kHz]" (y-axis) and "Time [ms]" (x-axis). The grid includes six distinct conditions: Left ear, Right ear, Nocturnal nature, Forrest walk, and City center.
---
### Components/Axes
1. **Axes**:
- **Y-axis**: Frequency [kHz], ranging from 0 to 7.1 kHz in increments of 3.5 kHz.
- **X-axis**: Time [ms], ranging from 0 to 8.7 ms in increments of 4.3 ms.
2. **Heatmap Titles** (top of each plot):
- Top row: "Left ear" (left), "Right ear" (right).
- Middle row: "Nocturnal nature" (left), "Forrest walk" (right).
- Bottom row: "City center" (right; left plot unlabeled in the image).
3. **Color Gradient**:
- Blue (low intensity) to red (high intensity), with white indicating near-zero values.
---
### Detailed Analysis
1. **Left ear (Top-left)**:
- **Trend**: Gradual transition from red (high intensity) at the top (7.1 kHz) to blue (low intensity) at the bottom (0 kHz). White streaks indicate intermittent low-intensity signals.
- **Key values**:
- 7.1 kHz: Dominant red (high intensity) across 0–4.3 ms.
- 3.5 kHz: Mixed red/white (moderate intensity) at 4.3–8.7 ms.
- 0 kHz: Blue (low intensity) at 8.7 ms.
2. **Right ear (Top-right)**:
- **Trend**: Similar gradient to Left ear but with irregular red patches in the middle frequencies (3.5–5.25 kHz) at 4.3–6.4 ms.
- **Key values**:
- 7.1 kHz: Red at 0–2.15 ms, fading to white.
- 3.5 kHz: Red patches at 4.3–6.4 ms.
- 0 kHz: Blue at 8.7 ms.
3. **Nocturnal nature (Middle-left)**:
- **Trend**: Scattered red and blue spots across all frequencies. Red dominates at 7.1 kHz (0–4.3 ms), while blue clusters at 0–1.75 kHz (4.3–8.7 ms).
- **Key values**:
- 7.1 kHz: Red at 0–4.3 ms.
- 3.5 kHz: Intermittent red spots at 4.3–6.4 ms.
- 0 kHz: Blue at 8.7 ms.
4. **Forrest walk (Middle-right)**:
- **Trend**: Blue dominates at lower frequencies (0–3.5 kHz) with sporadic red spots at 7.1 kHz (0–4.3 ms). Red patches increase at 3.5 kHz (4.3–8.7 ms).
- **Key values**:
- 7.1 kHz: Red at 0–4.3 ms.
- 3.5 kHz: Red at 6.4–8.7 ms.
- 0 kHz: Blue at 8.7 ms.
5. **City center (Bottom-right)**:
- **Trend**: Uniform red gradient at 7.1 kHz (0–8.7 ms) with a blue streak at 0 kHz (8.7 ms). Red intensity decreases slightly at 4.3–6.4 ms.
- **Key values**:
- 7.1 kHz: Red across all time points.
- 3.5 kHz: Red at 0–6.4 ms, fading to white at 8.7 ms.
- 0 kHz: Blue at 8.7 ms.
---
### Key Observations
1. **Frequency-specific patterns**:
- High-frequency signals (7.1 kHz) dominate in "Left ear," "Right ear," and "City center."
- Low-frequency signals (0 kHz) are consistently low-intensity across all conditions.
2. **Environmental influence**:
- "City center" shows the most consistent high-frequency activity, suggesting urban noise.
- "Forrest walk" and "Nocturnal nature" exhibit sporadic high-frequency signals, likely from natural sounds.
3. **Ear asymmetry**:
- "Left ear" and "Right ear" heatmaps differ slightly in red patch distribution, indicating directional hearing or environmental asymmetry.
---
### Interpretation
The data suggests that auditory frequency distribution varies significantly with environmental context and ear orientation. The "City center" condition demonstrates sustained high-frequency activity, consistent with urban noise pollution. In contrast, "Forrest walk" and "Nocturnal nature" show intermittent high-frequency signals, possibly reflecting natural soundscapes. The asymmetry between left and right ear heatmaps may indicate differences in sound localization or exposure to directional noise sources. The white streaks in "Left ear" and "Nocturnal nature" could represent gaps in signal detection, potentially due to acoustic interference or sensor limitations.