\n
## Scatter Plot: Hits@1 vs. Latency on WebQSP
### Overview
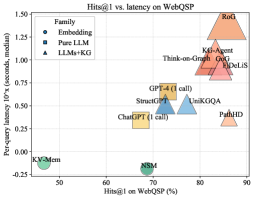
This scatter plot visualizes the relationship between Hits@1 (percentage) on the WebQSP dataset and per-query latency (in seconds, median) for various models. The models are categorized into three families: Embedding, Pure LLM, and LLMs+KG. Each point represents a model, and its position indicates its performance on both metrics.
### Components/Axes
* **X-axis:** Hits@1 on WebQSP (%) - Ranges from approximately 50% to 90%.
* **Y-axis:** Per-query latency 10^x (seconds, median) - Ranges from approximately -0.25 to 1.50. The axis is on a logarithmic scale.
* **Legend (Top-Left):**
* **Embedding (Blue Circles):** Represents models using embedding techniques.
* **Pure LLM (Blue Squares):** Represents models that are purely Large Language Models.
* **LLMs+KG (Black Triangles):** Represents models that combine Large Language Models with Knowledge Graphs.
### Detailed Analysis
The plot contains data points for the following models, categorized by their family:
**Embedding (Blue Circles):**
* **KV-Mem:** Located at approximately (52%, -0.25).
* **NSM:** Located at approximately (71%, -0.25).
**Pure LLM (Blue Squares):**
* **ChatGPT (1 call):** Located at approximately (69%, 0.25).
* **StructGPT:** Located at approximately (74%, 0.50).
* **GPT-4 (1 call):** Located at approximately (76%, 0.50).
* **UniKGQA:** Located at approximately (78%, 0.55).
**LLMs+KG (Black Triangles):**
* **Think-on-Graph:** Located at approximately (78%, 0.80).
* **KG-Agent:** Located at approximately (82%, 0.90).
* **GoG:** Located at approximately (83%, 1.00).
* **DeLIS:** Located at approximately (84%, 1.10).
* **RoG:** Located at approximately (89%, 1.40).
* **PathHD:** Located at approximately (81%, 0.30).
**Trends:**
* **Embedding Models:** Generally exhibit low latency and moderate Hits@1 scores.
* **Pure LLM Models:** Show a moderate increase in both latency and Hits@1 compared to Embedding models.
* **LLMs+KG Models:** Demonstrate the highest latency but also the highest Hits@1 scores. There is a clear upward trend within this category – as Hits@1 increases, so does latency.
### Key Observations
* There's a clear trade-off between latency and accuracy (Hits@1). Models with higher accuracy tend to have higher latency.
* LLMs+KG models consistently outperform the other two families in terms of Hits@1, but at the cost of increased latency.
* KV-Mem and NSM have significantly lower latency than all other models, but also lower Hits@1 scores.
* RoG has the highest latency and Hits@1.
### Interpretation
The data suggests that incorporating Knowledge Graphs (KGs) into LLMs significantly improves performance on the WebQSP dataset, as measured by Hits@1. However, this improvement comes at the expense of increased latency. Embedding models offer the fastest response times but sacrifice accuracy. The choice of model depends on the specific application requirements – whether speed or accuracy is more critical.
The upward trend within the LLMs+KG category indicates that more complex KG integration strategies (or larger KGs) lead to better performance but also higher computational costs. The positioning of models like RoG and DeLIS suggests they represent more sophisticated KG-enhanced LLMs.
The separation of the three families highlights the different approaches to question answering and their respective strengths and weaknesses. This plot provides valuable insights for selecting the appropriate model for a given task, considering the trade-off between accuracy and speed.