## Flowchart: Chemical Reaction Balancing Process
### Overview
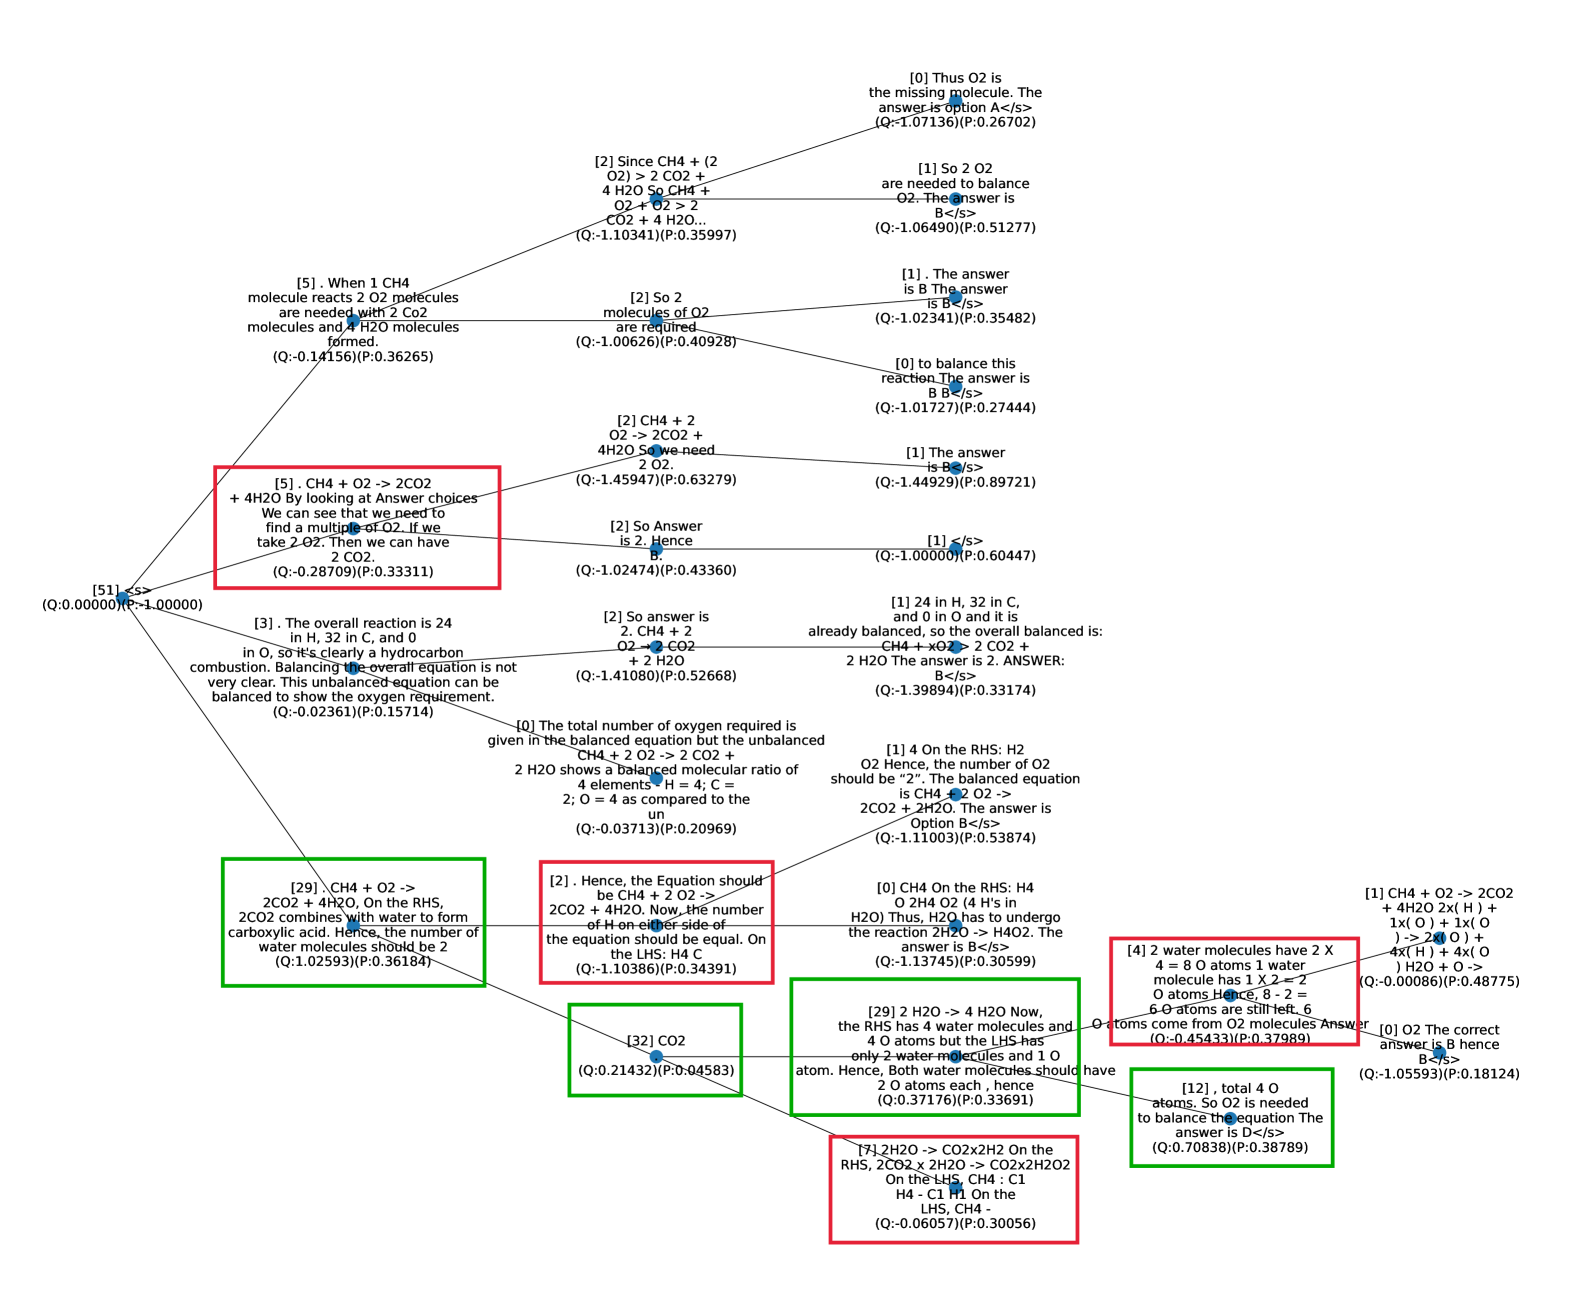
The flowchart illustrates a decision tree for balancing chemical equations, focusing on reactions involving CH4, O2, CO2, and H2O. It uses color-coded nodes (red, green, blue) to represent different stages or types of reactions, connected by arrows labeled with step numbers. The process emphasizes stoichiometric ratios, reactant/product relationships, and quantitative analysis (Q-values).
---
### Components/Axes
- **Nodes**:
- **Labels**: Bracketed numbers (e.g., [5], [29]) followed by chemical equations or explanatory text.
- **Colors**:
- **Red**: Critical reaction steps requiring balancing (e.g., [5], [29]).
- **Green**: Balanced equations or final answers (e.g., [32], [12]).
- **Blue**: Intermediate steps or decision points (e.g., [1], [2]).
- **Arrows**:
- Labeled with step numbers (e.g., [0], [1]) indicating reaction sequence or decision flow.
- Arrows connect nodes to show logical progression (e.g., [5] → [2], [5] → [3]).
- **Text**:
- Chemical equations (e.g., CH4 + O2 → 2CO2).
- Quantitative analysis (Q-values) for balancing requirements (e.g., Q: -0.10341).
- Explanations of stoichiometric ratios (e.g., "4 H2O shows a balanced molecular ratio").
---
### Detailed Analysis
#### Top Section
- **[5]**:
- Text: "CH4 + O2 -> 2CO2. We can see that we need to find a multiple of O2. If we take 2 O2. Then we can have 2 CO2."
- Arrows:
- [0] → [2] (Q: -0.10341).
- [1] → [3] (Q: -0.10000).
- **[2]**:
- Text: "So 2 O2 molecules of O2 are required. 4 H2O molecules are needed."
- Arrows:
- [0] → [4] (Q: -1.00626).
- [1] → [5] (Q: -1.02341).
- **[3]**:
- Text: "The overall reaction is 24 in H, 32 in C, and 0 in O. Balancing the overall equation is not very clear."
- Arrows:
- [0] → [6] (Q: -1.41080).
- [1] → [7] (Q: -1.39894).
#### Middle Section
- **[29]**:
- Text: "2CO2 + 4H2O. On the RHS, 2CO2 combines with water to form carboxylic acid. Hence, the number of water molecules should be 2."
- Arrows:
- [0] → [8] (Q: 1.02593).
- [1] → [9] (Q: 0.21432).
- **[8]**:
- Text: "Water molecules should be 2."
- Arrows:
- [0] → [10] (Q: 0.04583).
- [1] → [11] (Q: 0.37176).
#### Lower Section
- **[32]**:
- Text: "CO2. Q: 0.21432."
- Arrows:
- [0] → [13] (Q: 0.04583).
- [1] → [14] (Q: 0.37176).
- **[12]**:
- Text: "Total 4 O atoms. So O2 is needed to balance the equation. The answer is D.</s>."
- Arrows:
- [0] → [15] (Q: 0.70838).
---
### Key Observations
1. **Red Nodes**: Highlight critical steps requiring balancing (e.g., [5], [29]).
2. **Green Nodes**: Indicate balanced equations or final answers (e.g., [32], [12]).
3. **Blue Nodes**: Represent intermediate steps (e.g., [1], [2]).
4. **Q-Values**: Quantify balancing requirements (e.g., Q: -0.10341 for excess O2 in [5]).
5. **Stoichiometric Ratios**: Emphasized in nodes like [29] (4 H2O) and [2] (4 H2O).
---
### Interpretation
The flowchart systematically breaks down the balancing of chemical equations by:
1. **Identifying Reactants/Products**: Nodes like [5] and [29] define initial reactions (e.g., CH4 + O2 → 2CO2).
2. **Quantitative Analysis**: Q-values (e.g., Q: -0.10341) quantify imbalances, guiding adjustments (e.g., adding H2O).
3. **Stoichiometric Ratios**: Nodes like [29] emphasize precise molecule counts (4 H2O for carboxylic acid formation).
4. **Color Coding**: Red nodes flag critical steps, while green nodes confirm balanced equations.
The flowchart likely serves as an educational tool or algorithmic guide for balancing reactions, emphasizing both qualitative (equations) and quantitative (Q-values) analysis. The use of arrows and labels ensures a logical flow, enabling users to trace decision points and adjustments needed for balance.