\n
## Line Chart: Loss vs. Epoch for Different Models
### Overview
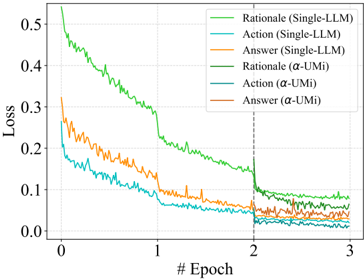
The image presents a line chart illustrating the loss function values over epochs for six different models or configurations. The chart compares the performance of "Single-LLM" and "α-UMi" approaches across three tasks: "Rationale", "Action", and "Answer". The y-axis represents "Loss", while the x-axis represents "# Epoch".
### Components/Axes
* **X-axis:** "# Epoch" - Ranges from approximately 0 to 3.
* **Y-axis:** "Loss" - Ranges from approximately 0.0 to 0.55.
* **Legend:** Located in the top-right corner, listing the following data series:
* Rationale (Single-LLM) - Green line
* Action (Single-LLM) - Light-blue line
* Answer (Single-LLM) - Orange line
* Rationale (α-UMi) - Dark-blue line
* Action (α-UMi) - Teal line
* Answer (α-UMi) - Brown line
### Detailed Analysis
Here's a breakdown of each line's trend and approximate data points:
* **Rationale (Single-LLM) - Green Line:** Starts at approximately 0.52 at Epoch 0, steadily decreases to around 0.12 at Epoch 2, and then fluctuates between 0.06 and 0.12 until Epoch 3.
* **Action (Single-LLM) - Light-blue Line:** Begins at approximately 0.25 at Epoch 0, decreases to around 0.08 at Epoch 2, and remains relatively stable between 0.06 and 0.09 until Epoch 3.
* **Answer (Single-LLM) - Orange Line:** Starts at approximately 0.32 at Epoch 0, decreases to around 0.07 at Epoch 2, and fluctuates between 0.05 and 0.08 until Epoch 3.
* **Rationale (α-UMi) - Dark-blue Line:** Starts at approximately 0.18 at Epoch 0, decreases to around 0.05 at Epoch 1.5, and remains relatively stable between 0.04 and 0.06 until Epoch 3.
* **Action (α-UMi) - Teal Line:** Begins at approximately 0.15 at Epoch 0, decreases to around 0.04 at Epoch 1.5, and remains relatively stable between 0.03 and 0.05 until Epoch 3.
* **Answer (α-UMi) - Brown Line:** Starts at approximately 0.12 at Epoch 0, decreases to around 0.04 at Epoch 1.5, and remains relatively stable between 0.03 and 0.05 until Epoch 3.
All lines exhibit a decreasing trend initially, indicating that the loss is decreasing as the models are trained. There is a noticeable drop in loss for all models around Epoch 2.
### Key Observations
* The "Rationale (Single-LLM)" line consistently has the highest loss values throughout the training process.
* The "α-UMi" models consistently exhibit lower loss values compared to their "Single-LLM" counterparts.
* The loss values for all models appear to converge towards a stable level after Epoch 2.
* The "Action" and "Answer" tasks for both model types show similar loss trajectories.
### Interpretation
The chart demonstrates that the "α-UMi" approach generally outperforms the "Single-LLM" approach across all three tasks ("Rationale", "Action", and "Answer") in terms of minimizing loss. The consistent lower loss values for "α-UMi" suggest that this model is learning more effectively and achieving better performance. The sharp decrease in loss around Epoch 2 could indicate a significant learning event or a change in the model's optimization process. The convergence of loss values after Epoch 2 suggests that the models are approaching a point of diminishing returns in terms of further training. The higher loss associated with the "Rationale" task for the "Single-LLM" model might indicate that generating rationales is a more challenging task for this model compared to performing actions or providing answers. The data suggests that the α-UMi model is more efficient at learning and generalizing across the different tasks.