## Line Chart: Mathematical Plot of $D(S(n,l))$
### Overview
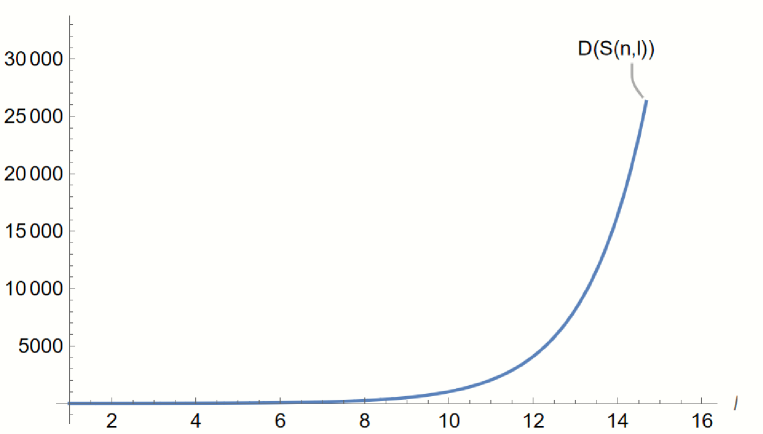
The image displays a single, continuous mathematical plot representing the function $D(S(n,l))$ as a function of the variable $l$. The plot illustrates a rapid, non-linear increase in value as $l$ increases, characteristic of exponential or combinatorial growth.
### Components/Axes
* **Y-Axis (Vertical):** Represents the output value of the function $D(S(n,l))$. The scale ranges from 0 to 30,000, with major tick marks at intervals of 5,000 (0, 5000, 10000, 15000, 20000, 25000, 30000).
* **X-Axis (Horizontal):** Represents the variable $l$. The scale ranges from 2 to 16, with major tick marks at intervals of 2 (2, 4, 6, 8, 10, 12, 14, 16).
* **Data Series:** A single, solid blue line representing the function $D(S(n,l))$.
* **Annotation:** A text label "$D(S(n,l))$" is positioned in the upper-right quadrant, with a leader line pointing to the terminus of the blue curve.
### Detailed Analysis
**Trend Verification:**
The curve exhibits a "hockey stick" growth pattern.
* **Initial Phase ($l = 2$ to $l \approx 8$):** The curve is nearly horizontal, remaining very close to the x-axis (y-values near 0).
* **Transition Phase ($l \approx 8$ to $l \approx 10$):** The curve begins to slope upward, indicating the onset of accelerated growth.
* **Explosive Phase ($l \approx 10$ to $l \approx 14.8$):** The slope increases dramatically, indicating super-linear or exponential growth.
**Data Point Approximations:**
* At $l = 8$: The value is approximately 500.
* At $l = 10$: The value is approximately 1,500 to 2,000.
* At $l = 12$: The value is approximately 6,000 to 7,000.
* At $l = 14$: The value is approximately 20,000.
* At $l \approx 14.8$ (terminus): The value is approximately 26,000 to 27,000.
### Key Observations
* **Non-Linearity:** The function is clearly non-linear. The rate of change (derivative) increases significantly as $l$ increases.
* **Abrupt Termination:** The curve ends abruptly at $l \approx 14.8$. This suggests either a computational limit (the calculation was stopped) or a physical constraint on the system being modeled.
* **Notation:** The notation $S(n,l)$ is standard in computer science and combinatorics, often representing a search space of size $n$ with length $l$.
### Interpretation
The data demonstrates a classic case of **combinatorial explosion**.
* **What the data suggests:** The function $D(S(n,l))$ likely represents a metric of complexity, such as the number of states to explore, the number of operations required, or the size of a search tree. The visual evidence shows that for small values of $l$ (below 8), the problem is computationally trivial. However, as $l$ approaches 15, the "cost" or "size" of the function grows so rapidly that it likely becomes computationally intractable.
* **Why it matters:** This type of graph is frequently used in technical documentation to justify the need for heuristics, approximation algorithms, or pruning techniques in search algorithms. It visually communicates the "wall" that developers hit when scaling systems that rely on exhaustive search or brute-force methods.
* **Peircean Investigative Note:** The abrupt termination of the line at $l \approx 14.8$ is a significant anomaly. It implies that the system generating this plot likely encountered a memory overflow, a timeout, or a hard-coded limit in the simulation software, rather than the function naturally ending. The graph is a warning of the limitations of the underlying algorithm.