## Line Chart: Optimal Epsilon vs. Alpha
### Overview
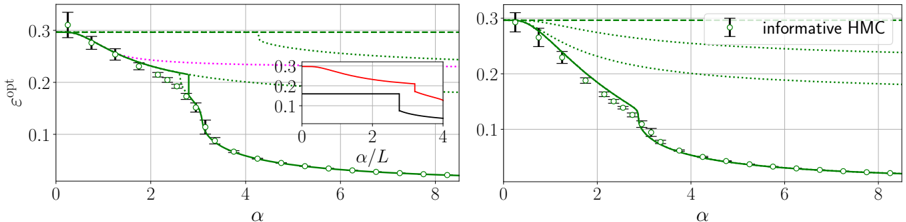
The image contains two line charts comparing optimal epsilon values against alpha. Both charts display similar trends, with a rapid decrease in epsilon as alpha increases, eventually plateauing at a low value. The left chart includes an inset plot and additional horizontal lines, while the right chart features a legend identifying the "informative HMC" data series.
### Components/Axes
* **Left Chart:**
* Y-axis: ε<sup>opt</sup>, ranging from 0 to 0.3.
* X-axis: α, ranging from 0 to 8.
* Inset Plot:
* Y-axis: Unlabeled, ranging from approximately 0 to 0.3.
* X-axis: α/L, ranging from 0 to 4.
* Lines:
* Solid Green Line: Represents the primary data series.
* Dashed Green Line: Horizontal line at approximately ε<sup>opt</sup> = 0.3.
* Dotted Green Line: Starts at approximately ε<sup>opt</sup> = 0.3 and decreases to approximately 0.2.
* Dotted Magenta Line: Horizontal line at approximately ε<sup>opt</sup> = 0.24.
* Inset Red Line: Starts at approximately 0.3 and decreases to approximately 0.2 at α/L = 4.
* Inset Black Line: Horizontal line at approximately 0.15 until α/L = 3, then decreases to approximately 0.05 at α/L = 4.
* Data Points: Green circles with error bars along the solid green line.
* **Right Chart:**
* Y-axis: ε<sup>opt</sup>, ranging from 0 to 0.3.
* X-axis: α, ranging from 0 to 8.
* Lines:
* Solid Green Line: Represents the primary data series.
* Dashed Green Line: Horizontal line at approximately ε<sup>opt</sup> = 0.3.
* Dotted Green Line: Starts at approximately ε<sup>opt</sup> = 0.3 and decreases to approximately 0.2.
* Data Points: Green circles with error bars along the solid green line.
* Legend (Top-Right): "informative HMC" associated with the green data points.
### Detailed Analysis
* **Left Chart:**
* Solid Green Line: Starts at approximately (0, 0.3) and rapidly decreases to approximately (4, 0.03), then plateaus.
* Dashed Green Line: Constant at approximately ε<sup>opt</sup> = 0.3.
* Dotted Green Line: Starts at approximately (0, 0.3) and decreases to approximately (4, 0.2).
* Dotted Magenta Line: Constant at approximately ε<sup>opt</sup> = 0.24.
* Inset Red Line: Starts at approximately (0, 0.3) and decreases to approximately (4, 0.2).
* Inset Black Line: Constant at approximately (0, 0.15) until α/L = 3, then decreases to approximately (4, 0.05).
* **Right Chart:**
* Solid Green Line: Starts at approximately (0, 0.3) and rapidly decreases to approximately (4, 0.03), then plateaus.
* Dashed Green Line: Constant at approximately ε<sup>opt</sup> = 0.3.
* Dotted Green Line: Starts at approximately (0, 0.3) and decreases to approximately (4, 0.2).
* Data points (informative HMC): The green circles with error bars follow the solid green line.
### Key Observations
* Both charts show a similar trend: a rapid decrease in optimal epsilon as alpha increases, followed by a plateau.
* The left chart provides additional context with the inset plot and magenta line, potentially showing different models or parameters.
* The right chart explicitly labels the data series as "informative HMC."
* The error bars on the data points are relatively small, indicating a degree of precision in the measurements.
### Interpretation
The charts likely illustrate the relationship between a parameter "alpha" and the optimal value of "epsilon" in a Hamiltonian Monte Carlo (HMC) simulation or related algorithm. The rapid decrease in epsilon<sup>opt</sup> suggests that as alpha increases, the system becomes more stable or efficient, requiring a smaller step size (epsilon) for optimal performance. The plateau indicates a point of diminishing returns, where further increases in alpha do not significantly improve the system's behavior.
The inset plot in the left chart may represent a different scaling or a different model altogether, providing a comparative perspective. The magenta line could represent a theoretical limit or a different optimization strategy.
The "informative HMC" label on the right chart suggests that this particular configuration or algorithm is being highlighted for its performance.