\n
## Diagram: BFS Reasoning Flow for Question Answering
### Overview
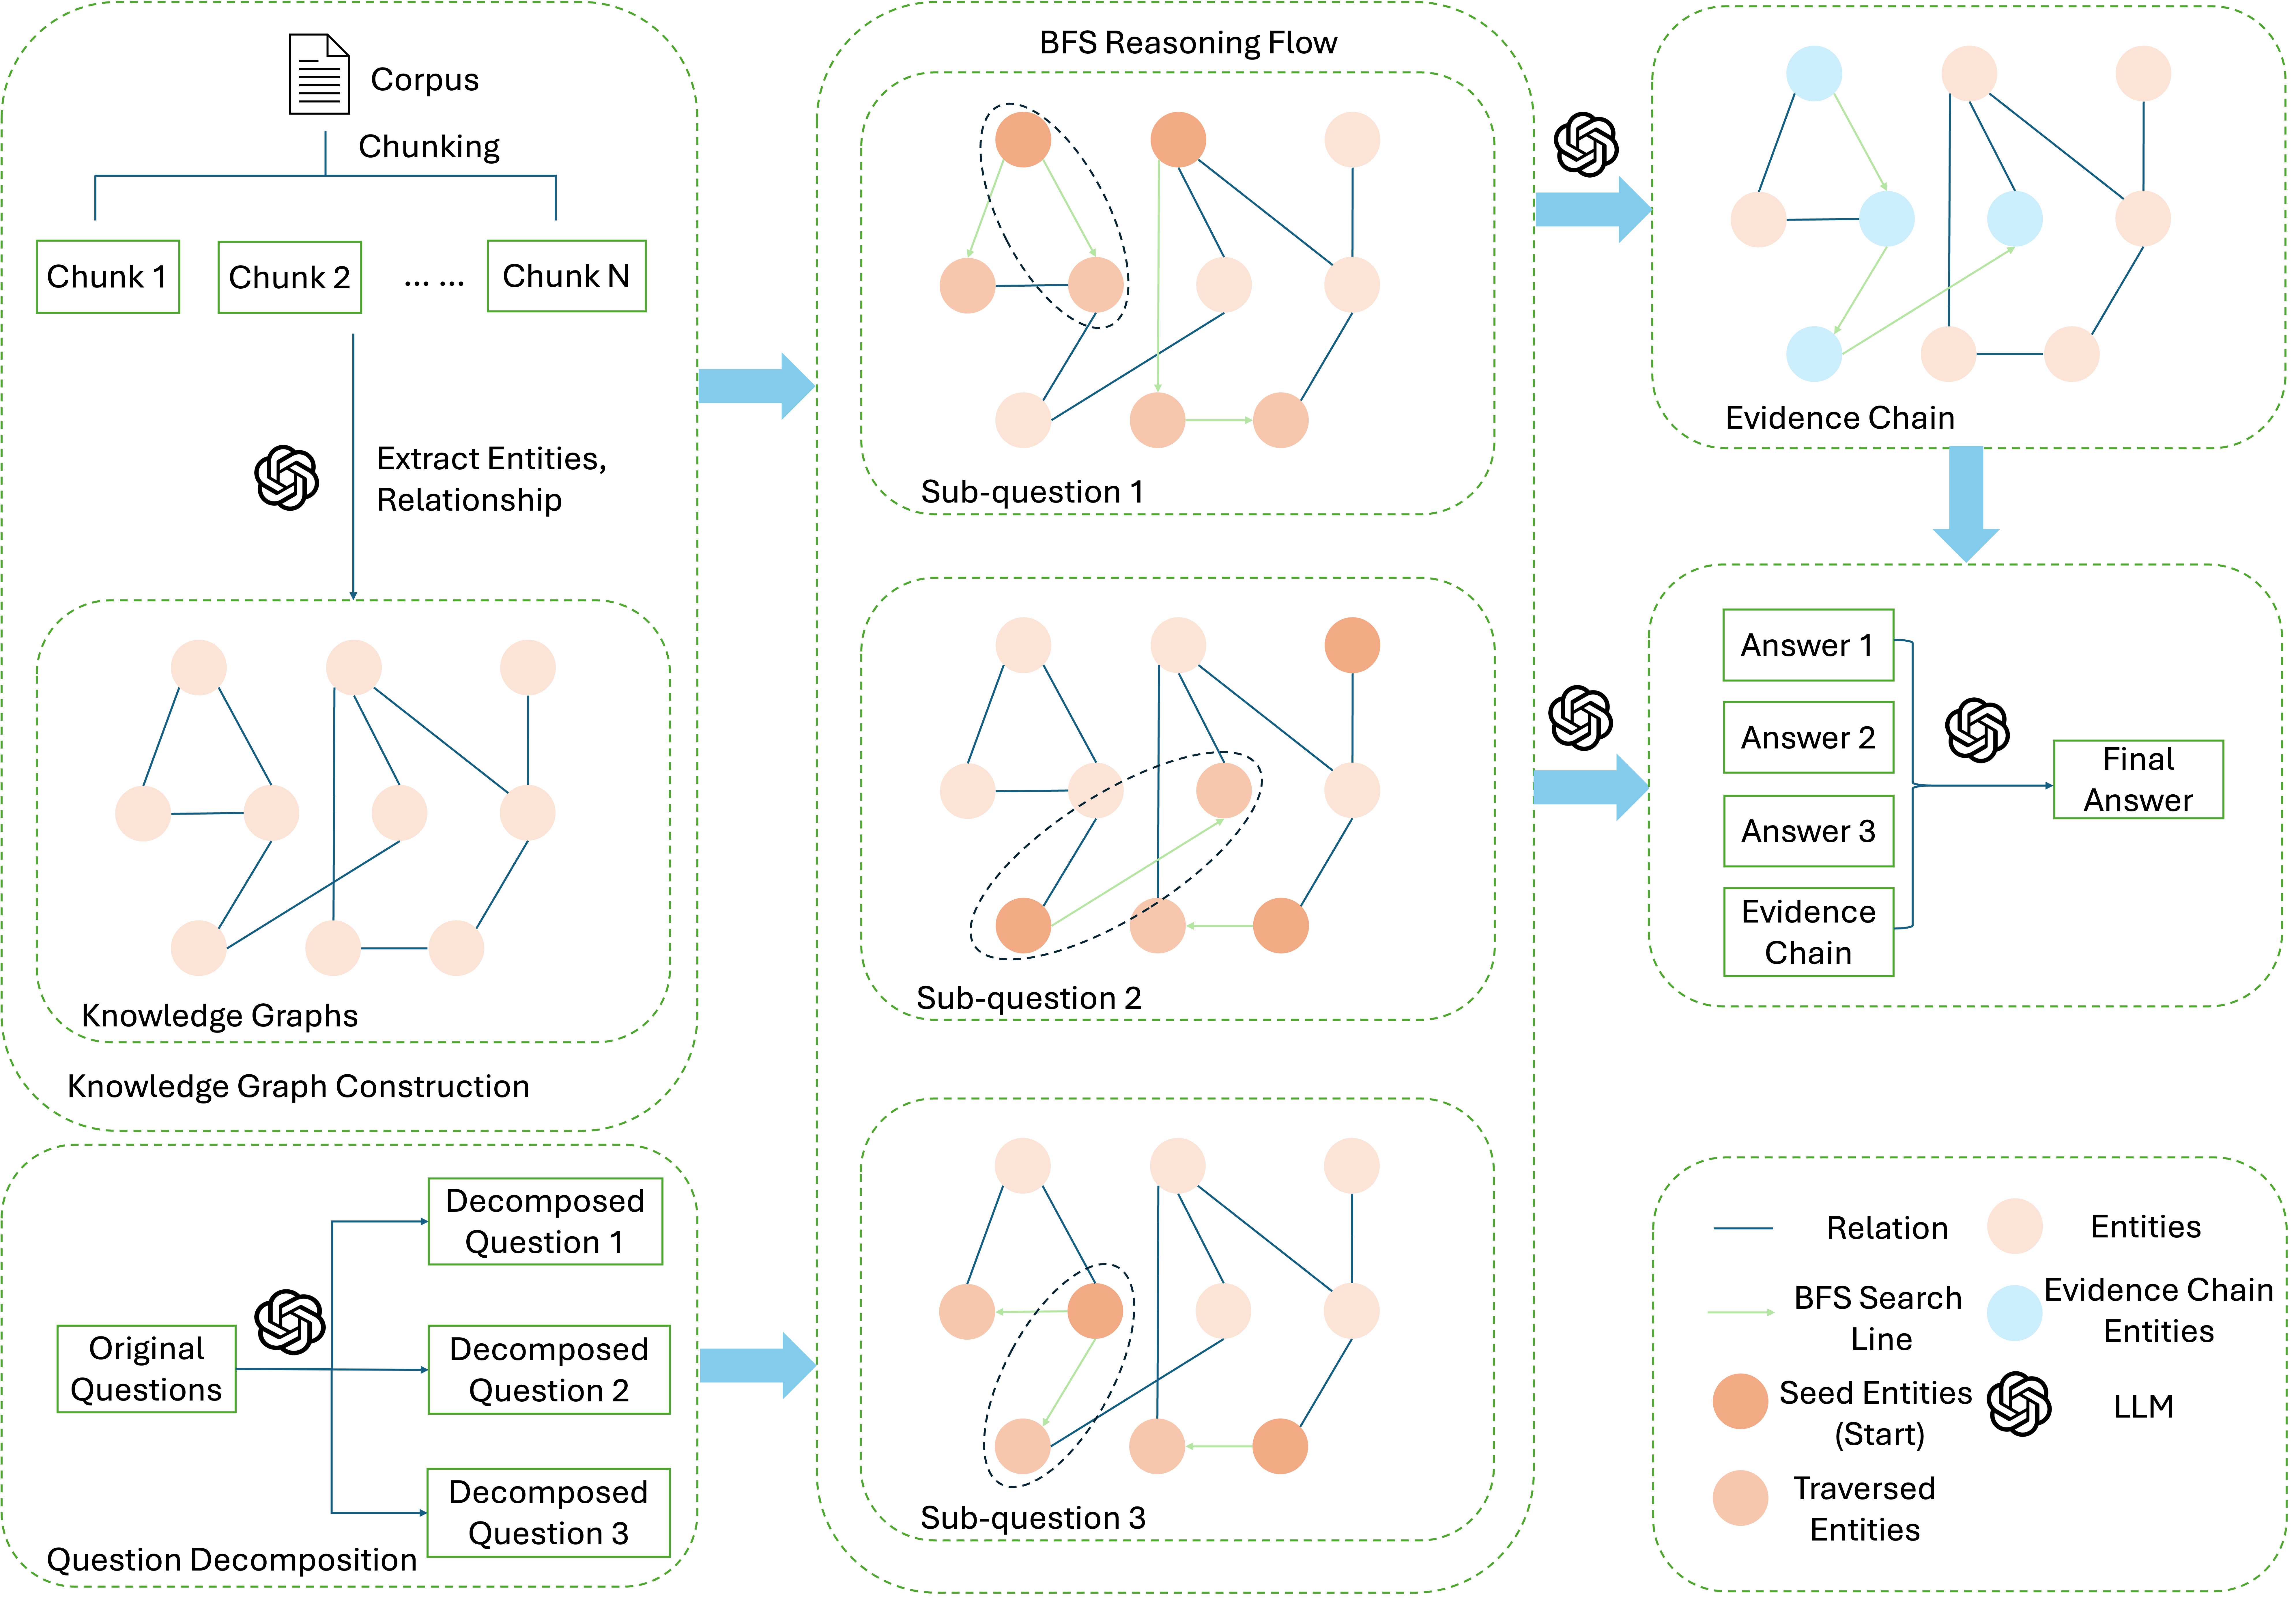
This diagram illustrates a multi-stage process for question answering using Breadth-First Search (BFS) reasoning. The process begins with corpus chunking, proceeds through knowledge graph construction and sub-question decomposition, utilizes BFS to build evidence chains, and culminates in a final answer. The diagram is organized into a 3x3 grid, representing the sequential steps of the process.
### Components/Axes
The diagram consists of nine interconnected blocks, each representing a stage in the reasoning flow. A legend in the bottom-right corner defines the visual elements:
* **Relation:** Represented by a grey line.
* **Entities:** Represented by orange circles.
* **BFS Search Line:** Represented by a light blue line.
* **Seed Entities (Start):** Represented by a dark blue circle.
* **Traversed Entities:** Represented by a light orange circle.
* **LLM:** Not explicitly represented visually, but implied in the process.
The blocks are labeled as follows:
1. **Corpus Chunking:** Top-left.
2. **Extract Entities, Relationship:** Middle-left.
3. **Knowledge Graphs Knowledge Graph Construction:** Bottom-left.
4. **Sub-question 1:** Top-center.
5. **Sub-question 2:** Middle-center.
6. **Sub-question 3:** Bottom-center.
7. **Evidence Chain:** Top-right.
8. **Evidence Chain:** Middle-right.
9. **Final Answer:** Bottom-right.
Each block contains a network of nodes (orange and blue circles) connected by lines (grey and light blue). Text labels within the blocks indicate the stage of processing.
### Detailed Analysis or Content Details
**1. Corpus Chunking:** Displays "Chunk 1", "Chunk 2", and "Chunk N" indicating the corpus is divided into multiple chunks.
**2. Extract Entities, Relationship:** Shows a network of orange circles connected by grey lines, representing entities and their relationships.
**3. Knowledge Graphs Knowledge Graph Construction:** Similar to the previous block, displaying a network of orange circles and grey lines, representing the constructed knowledge graph.
**4. Sub-question 1:** A network of orange and light orange circles connected by grey and light blue lines. A dark blue circle is present, representing the seed entity.
**5. Sub-question 2:** Similar to Sub-question 1, with a different arrangement of nodes and connections.
**6. Sub-question 3:** Similar to Sub-question 1 and 2, with a different arrangement of nodes and connections.
**7. Evidence Chain:** A network of orange and light orange circles connected by grey and light blue lines, forming a more complex chain-like structure.
**8. Evidence Chain:** Displays "Answer 1", "Answer 2", "Answer 3", and "Evidence Chain" within the network of nodes.
**9. Final Answer:** Displays "Final Answer" within the network of nodes.
The BFS search lines (light blue) appear to radiate outwards from the seed entities (dark blue) in the sub-question blocks, indicating the search process. The evidence chain blocks show a more interconnected network, suggesting the aggregation of evidence.
### Key Observations
The diagram highlights a sequential process where information is progressively refined. The initial stages focus on data preparation (chunking, entity extraction), followed by knowledge representation (knowledge graphs), question decomposition, and finally, reasoning and answer generation. The use of BFS is visually emphasized by the radiating search lines. The evidence chain blocks demonstrate the accumulation of supporting information.
### Interpretation
This diagram illustrates a sophisticated approach to question answering that leverages knowledge graphs and BFS reasoning. The process aims to break down complex questions into smaller, manageable sub-questions, search for relevant evidence within a knowledge graph, and synthesize the evidence to arrive at a final answer. The diagram suggests a modular and scalable architecture, where each stage can be independently optimized. The use of BFS implies a systematic exploration of the knowledge graph, ensuring that all relevant information is considered. The diagram doesn't provide specific data or numerical values, but rather a conceptual framework for a question-answering system. The diagram is a high-level overview and does not detail the specific algorithms or techniques used in each stage. The diagram suggests a system designed to handle complex questions requiring reasoning and evidence gathering.