## Charts/Graphs: Recurrent Neural Network Training and Spike Patterns
### Overview
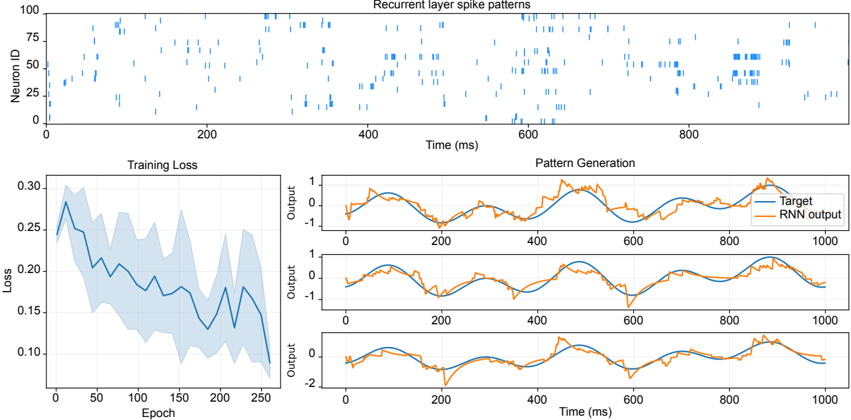
The image presents a series of charts illustrating the training process and output patterns of a recurrent neural network (RNN). The top chart displays the spike patterns of neurons in the recurrent layer over time. The bottom-left chart shows the training loss as a function of epoch. The bottom-right charts show pattern generation, comparing the target output with the RNN output over time for three different patterns.
### Components/Axes
* **Top Chart:**
* Title: "Recurrent layer spike patterns"
* X-axis: "Time (ms)", ranging from 0 to 900, with markers every 100 ms.
* Y-axis: "Neuron ID", ranging from 0 to 100, with markers every 25.
* Data: Blue vertical lines representing spike events for individual neurons at specific times.
* **Bottom-Left Chart:**
* Title: "Training Loss"
* X-axis: "Epoch", ranging from 0 to 250, with markers every 50.
* Y-axis: "Loss", ranging from 0.10 to 0.30, with markers every 0.05.
* Data: A blue line representing the training loss over epochs, with a shaded region indicating the standard deviation.
* **Bottom-Right Charts (3 subplots):**
* Title: "Pattern Generation"
* X-axis: "Time (ms)", ranging from 0 to 1000, with markers every 200.
* Y-axis: "Output", ranging from -2 to 2, with markers every 0.5.
* Data:
* Blue line: "Target" output pattern.
* Orange line: "RNN output" pattern.
* Legend: Located in the top-right corner of the first subplot, labeling the blue line as "Target" and the orange line as "RNN output".
### Detailed Analysis or Content Details
* **Top Chart:** The spike patterns appear somewhat random, with varying densities of spikes across different neurons and time intervals. There are periods of higher activity (more spikes) and periods of relative silence. The distribution of spikes seems fairly uniform across the neuron IDs.
* **Bottom-Left Chart:** The training loss initially decreases rapidly from approximately 0.27 at epoch 0 to around 0.16 at epoch 50. After epoch 50, the loss decreases more slowly, with fluctuations. At epoch 250, the loss is approximately 0.13. The shaded region indicates a relatively large standard deviation, suggesting some variability in the training process.
* **Bottom-Right Charts:**
* **Subplot 1:** The RNN output (orange line) closely follows the target output (blue line) throughout the entire time range. There is a slight phase shift, with the RNN output lagging behind the target output.
* **Subplot 2:** Similar to subplot 1, the RNN output closely tracks the target output, with a slight lag.
* **Subplot 3:** The RNN output again follows the target output, but with a more noticeable difference in amplitude. The RNN output appears to be slightly dampened compared to the target output.
### Key Observations
* The training loss decreases significantly during the initial epochs, indicating that the RNN is learning quickly.
* The spike patterns in the recurrent layer are complex and dynamic.
* The RNN is able to generate patterns that closely resemble the target patterns, but there are some discrepancies in timing and amplitude.
* The standard deviation of the training loss is relatively high, suggesting that the training process is not entirely stable.
### Interpretation
The data suggests that the RNN is successfully learning to generate the desired output patterns. The decreasing training loss indicates that the network is improving its ability to predict the target outputs. The spike patterns in the recurrent layer likely represent the internal representations that the network is using to encode and process information. The discrepancies between the target and RNN outputs suggest that there is still room for improvement in the network's performance. The high standard deviation of the training loss could be due to factors such as the complexity of the task, the size of the training dataset, or the choice of hyperparameters.
The RNN is demonstrating an ability to learn temporal dependencies, as evidenced by its ability to generate patterns that evolve over time. The comparison between the target and RNN outputs provides insights into the network's strengths and weaknesses. The observed lag in the RNN output could be due to the inherent delay in processing information through the recurrent connections. The dampened amplitude in the third subplot could be due to the network's tendency to regularize its outputs. Overall, the data suggests that the RNN is a promising approach for modeling and generating complex temporal patterns.