\n
## Diagram: Data Processing Pipeline
### Overview
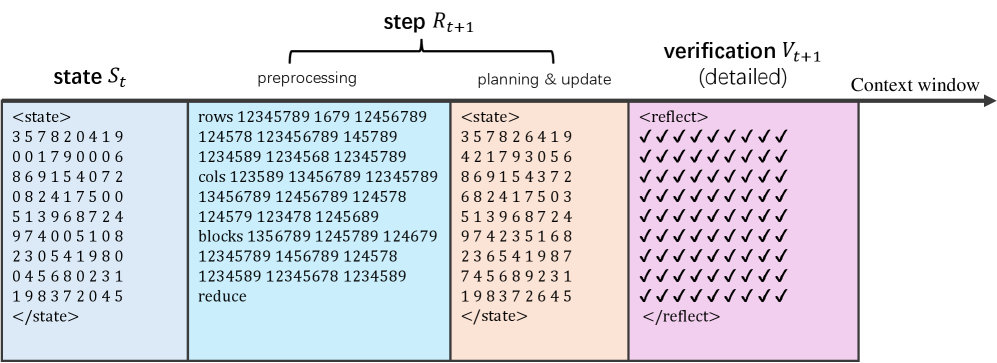
The image depicts a data processing pipeline with four stages: State (S<sub>t</sub>), Preprocessing, Planning & Update, and Verification (V<sub>t+1</sub>). An arrow labeled "step R<sub>t+1</sub>" connects the stages, indicating the flow of data. Each stage displays a block of numerical data enclosed within `<state>` or `<reflect>` tags. A "Context window" is shown on the far right.
### Components/Axes
The diagram consists of four rectangular blocks representing the processing stages, arranged horizontally. Each block contains a matrix of numbers. The blocks are labeled as follows:
* **State S<sub>t</sub>**: The initial state of the data.
* **Preprocessing**: The stage where initial data manipulation occurs.
* **Planning & Update**: The stage where the data is planned and updated.
* **Verification V<sub>t+1</sub>**: The final stage where the data is verified.
* **Context window**: A region to the right of the verification stage.
### Detailed Analysis or Content Details
**1. State S<sub>t</sub>:**
The data within the `<state>` tag is a 5x5 matrix of numbers:
```
3 5 7 8 2
0 0 1 7 9
8 6 9 1 5
0 8 2 4 1
5 1 3 9 6
```
**2. Preprocessing:**
The data within this block is organized into rows, columns, and blocks.
* **rows**: 12345789 1679 12456789
* **cols**: 123589 13456789 12345789
* **blocks**: 1356789 1245789 124679
* **reduce**: 12345789 1456789 124578
* The numerical data is a 5x5 matrix:
```
1 2 3 4 5
1 2 3 4 5
1 2 3 4 5
1 2 3 4 5
1 2 3 4 5
```
**3. Planning & Update:**
The data within the `<state>` tag is a 5x5 matrix of numbers:
```
3 5 7 8 2
4 2 1 7 9
8 6 9 1 5
6 8 2 4 1
5 1 3 9 6
```
**4. Verification V<sub>t+1</sub>:**
The data within the `<reflect>` tag consists of a series of checkmark symbols (√) arranged in a 5x9 grid.
```
√ √ √ √ √ √ √ √ √
√ √ √ √ √ √ √ √ √
√ √ √ √ √ √ √ √ √
√ √ √ √ √ √ √ √ √
√ √ √ √ √ √ √ √ √
```
### Key Observations
* Each stage transforms the data in a different way.
* The "Preprocessing" stage explicitly mentions operations on "rows", "cols", and "blocks", suggesting a data restructuring process.
* The "Verification" stage uses checkmarks, indicating a confirmation or validation process.
* The data within the "State" and "Planning & Update" stages are numerical matrices, while the "Preprocessing" stage includes both numerical matrices and textual descriptions of data organization.
### Interpretation
This diagram illustrates a simplified data processing pipeline. The initial "State" represents the raw data. "Preprocessing" involves restructuring and potentially reducing the data. "Planning & Update" likely applies some algorithm or model to the preprocessed data, resulting in an updated state. Finally, "Verification" confirms the validity or correctness of the updated data. The "Context window" suggests that the pipeline operates within a defined scope or boundary. The use of tags `<state>` and `<reflect>` implies a programmatic or computational context. The diagram is a high-level representation and doesn't specify the exact algorithms or transformations used in each stage. The consistent matrix size (5x5) across the "State" and "Planning & Update" stages suggests a structured data format. The checkmarks in the "Verification" stage indicate a successful validation process, but the diagram doesn't provide information about the criteria for validation.