\n
## Bar Chart: Private Score Loss Contributions by Model and Status
### Overview
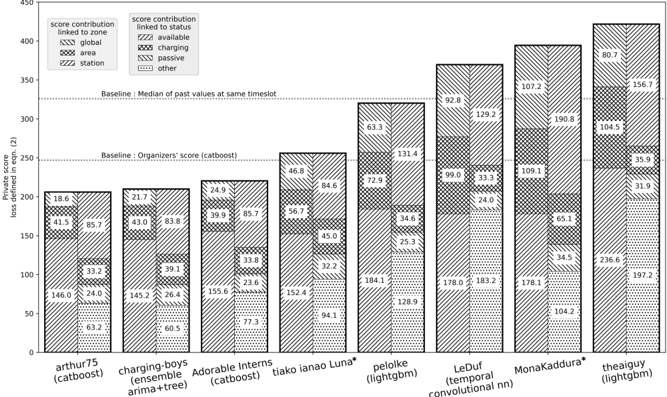
This image presents a bar chart comparing the "Private score loss defined in eqn. (2)" for several models, broken down by contributions linked to zone and status. The models are displayed along the x-axis, and the score loss is displayed on the y-axis, ranging from 0 to 450. Each bar is segmented to show the contribution of "global", "area", "station", "available", "charging", "passive", and "other" statuses. A baseline is indicated by a horizontal line.
### Components/Axes
* **X-axis:** Model names: "arthur75 (catboost)", "charging-boys (ensemble arima+tree)", "Adorable interns (catboost)", "tiako ianao Luna", "pelolke (lightgbm)", "LeDuf (temporal convolutional nn)", "MonaKaddura", "theaiguy (lightgbm)".
* **Y-axis:** "Private score loss defined in eqn. (2)", ranging from 0 to 450.
* **Legend 1 (Score contribution linked to zone):**
* "global" (solid fill)
* "area" (diagonal stripes, 45 degrees)
* "station" (dotted fill)
* **Legend 2 (Score contribution linked to status):**
* "available" (horizontal stripes)
* "charging" (vertical stripes)
* "passive" (cross-hatch)
* "other" (white)
* **Baseline:** A horizontal line labeled "Baseline: Organizer's score (catboost)" and "Baseline: Median of past values at same timestep".
### Detailed Analysis
Here's a breakdown of the score loss for each model, with approximate values based on the chart:
* **arthur75 (catboost):** Total score loss is approximately 185.
* Global: ~146.0
* Area: ~33.2
* Station: ~6.2
* Available: ~18.6
* Charging: ~85.7
* Passive: ~0
* Other: ~0
* **charging-boys (ensemble arima+tree):** Total score loss is approximately 220.
* Global: ~26.4
* Area: ~39.1
* Station: ~69.5
* Available: ~21.7
* Charging: ~43.0
* Passive: ~83.8
* Other: ~0
* **Adorable interns (catboost):** Total score loss is approximately 265.
* Global: ~155.6
* Area: ~33.8
* Station: ~77.3
* Available: ~24.9
* Charging: ~39.9
* Passive: ~85.7
* Other: ~0
* **tiako ianao Luna:** Total score loss is approximately 235.
* Global: ~94.1
* Area: ~32.2
* Station: ~45.0
* Available: ~84.6
* Charging: ~56.7
* Passive: ~0
* Other: ~0
* **pelolke (lightgbm):** Total score loss is approximately 330.
* Global: ~184.1
* Area: ~25.3
* Station: ~128.9
* Available: ~72.9
* Charging: ~34.6
* Passive: ~0
* Other: ~63.3
* **LeDuf (temporal convolutional nn):** Total score loss is approximately 305.
* Global: ~178.0
* Area: ~24.0
* Station: ~183.2
* Available: ~99.0
* Charging: ~33.3
* Passive: ~0
* Other: ~107.2
* **MonaKaddura:** Total score loss is approximately 395.
* Global: ~178.1
* Area: ~34.5
* Station: ~104.2
* Available: ~109.1
* Charging: ~190.8
* Passive: ~0
* Other: ~102.3
* **theaiguy (lightgbm):** Total score loss is approximately 430.
* Global: ~197.2
* Area: ~236.6
* Station: ~31.9
* Available: ~156.7
* Charging: ~80.7
* Passive: ~35.9
* Other: ~0
The baseline is approximately at a score loss of 250.
### Key Observations
* "theaiguy (lightgbm)" has the highest total score loss, significantly exceeding the baseline.
* "arthur75 (catboost)" has the lowest total score loss.
* The "charging" status consistently contributes a substantial portion of the score loss for most models.
* The "passive" and "other" statuses contribute very little to the score loss across all models.
* "Global" is the largest contributor to the score loss for most models.
### Interpretation
The chart demonstrates the performance of different models in terms of private score loss, broken down by zone and status. The varying contributions from each status suggest that the models differ in how they handle different operational conditions. The high score loss for "theaiguy (lightgbm)" indicates that this model performs relatively poorly compared to others, while "arthur75 (catboost)" performs the best. The consistent contribution of the "charging" status suggests that accurately predicting or managing charging events is a key challenge for all models. The baseline provides a reference point for evaluating the performance of each model. The differences in the composition of the score loss (e.g., the relative contributions of "global", "area", and "station") suggest that each model has different strengths and weaknesses in different zones. The lack of contribution from "passive" and "other" statuses may indicate that these statuses are less important or less frequently encountered in the dataset.