## Line Charts: Llama-3.2-1B and Llama-3.2-3B Performance
### Overview
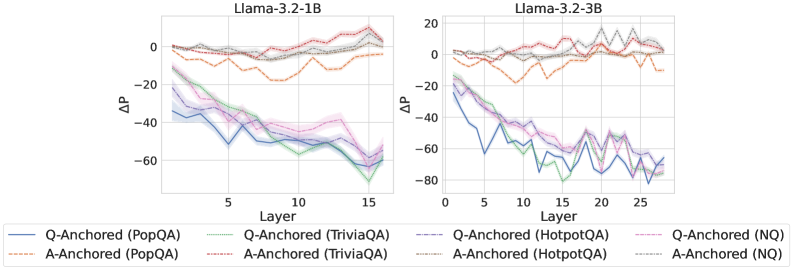
The image presents two line charts comparing the performance of Llama-3.2-1B and Llama-3.2-3B models across different layers. The y-axis represents ΔP (Delta P), and the x-axis represents the layer number. Each chart displays six data series, representing Q-Anchored and A-Anchored performance on PopQA, TriviaQA, HotpotQA, and NQ datasets.
### Components/Axes
* **Titles:**
* Left Chart: Llama-3.2-1B
* Right Chart: Llama-3.2-3B
* **Y-Axis:**
* Label: ΔP
* Scale: -80 to 20, with increments of 20 (-80, -60, -40, -20, 0, 20)
* **X-Axis:**
* Label: Layer
* Left Chart Scale: 0 to 15, with increments of 5 (0, 5, 10, 15)
* Right Chart Scale: 0 to 25, with increments of 5 (0, 5, 10, 15, 20, 25)
* **Legend:** Located at the bottom of the image.
* Q-Anchored (PopQA): Solid Blue Line
* A-Anchored (PopQA): Dashed Orange Line
* Q-Anchored (TriviaQA): Dotted Green Line
* A-Anchored (TriviaQA): Dashed-Dotted Brown Line
* Q-Anchored (HotpotQA): Dashed-Dotted Pink Line
* A-Anchored (HotpotQA): Dotted Grey Line
* Q-Anchored (NQ): Dashed-Dotted Pink Line
* A-Anchored (NQ): Dotted Grey Line
### Detailed Analysis
**Llama-3.2-1B (Left Chart)**
* **Q-Anchored (PopQA):** (Solid Blue Line) Starts at approximately -35 and generally decreases to around -60 by layer 15.
* **A-Anchored (PopQA):** (Dashed Orange Line) Starts near 0 and fluctuates between -15 and 0.
* **Q-Anchored (TriviaQA):** (Dotted Green Line) Starts at approximately -20 and decreases to around -60 by layer 15.
* **A-Anchored (TriviaQA):** (Dashed-Dotted Brown Line) Starts near 0 and remains relatively stable, fluctuating slightly.
* **Q-Anchored (HotpotQA):** (Dashed-Dotted Pink Line) Starts at approximately -30 and decreases to around -50 by layer 15.
* **A-Anchored (NQ):** (Dotted Grey Line) Starts near 0 and remains relatively stable, fluctuating slightly.
**Llama-3.2-3B (Right Chart)**
* **Q-Anchored (PopQA):** (Solid Blue Line) Starts at approximately -25 and decreases to around -75, with some fluctuations.
* **A-Anchored (PopQA):** (Dashed Orange Line) Starts near -5 and fluctuates significantly between -15 and 5.
* **Q-Anchored (TriviaQA):** (Dotted Green Line) Starts at approximately -20 and decreases to around -70, with some fluctuations.
* **A-Anchored (TriviaQA):** (Dashed-Dotted Brown Line) Starts near 10 and remains relatively stable, fluctuating slightly.
* **Q-Anchored (HotpotQA):** (Dashed-Dotted Pink Line) Starts at approximately -20 and decreases to around -60, with some fluctuations.
* **A-Anchored (NQ):** (Dotted Grey Line) Starts near 10 and remains relatively stable, fluctuating slightly.
### Key Observations
* For both models, the Q-Anchored lines (PopQA, TriviaQA, HotpotQA) generally show a decreasing trend as the layer number increases, indicating a drop in ΔP.
* The A-Anchored lines (PopQA, TriviaQA, NQ) tend to remain relatively stable near 0, with the exception of A-Anchored (PopQA) on Llama-3.2-3B, which fluctuates more.
* Llama-3.2-3B shows a more pronounced decrease in ΔP for the Q-Anchored lines compared to Llama-3.2-1B.
* The shaded regions around the lines indicate the uncertainty or variance in the data.
### Interpretation
The charts suggest that as the layer number increases, the performance (ΔP) of Q-Anchored tasks generally decreases for both Llama models. This could indicate that the model's ability to answer questions deteriorates in deeper layers. The A-Anchored tasks, on the other hand, remain relatively stable, suggesting that the model's ability to understand or process answers is less affected by the layer depth.
The Llama-3.2-3B model appears to exhibit a more significant performance drop in Q-Anchored tasks compared to Llama-3.2-1B, which could be due to the increased complexity or depth of the model. The fluctuations in the A-Anchored (PopQA) line for Llama-3.2-3B might indicate some instability or sensitivity in processing answers for that specific dataset.
The shaded regions provide a visual representation of the data's variability, which should be considered when interpreting the trends.