## Line Chart: Training and Testing Accuracy vs. Epoch
### Overview
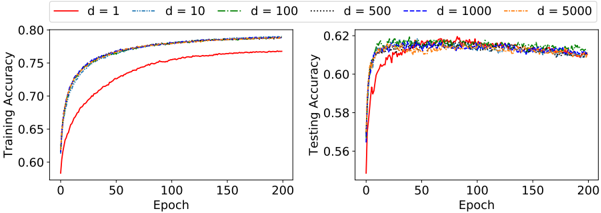
The image presents two line charts side-by-side. The left chart displays Training Accuracy against Epoch, while the right chart shows Testing Accuracy against Epoch. Both charts compare the performance of models with different values of 'd' (1, 10, 100, 500, 1000, and 5000). The charts aim to illustrate how the accuracy of these models evolves over training epochs.
### Components/Axes
* **X-axis (Both Charts):** Epoch, ranging from 0 to 200.
* **Y-axis (Left Chart):** Training Accuracy, ranging from 0.60 to 0.80.
* **Y-axis (Right Chart):** Testing Accuracy, ranging from 0.55 to 0.63.
* **Legend (Top-Center):**
* `d = 1` (Solid Red Line)
* `d = 10` (Dashed Red Line)
* `d = 100` (Dashed-Dotted Red Line)
* `d = 500` (Solid Blue Line)
* `d = 1000` (Dashed Blue Line)
* `d = 5000` (Dashed-Dotted Blue Line)
### Detailed Analysis or Content Details
**Left Chart (Training Accuracy):**
* **d = 1 (Solid Red):** Starts at approximately 0.60 at Epoch 0, increases rapidly to around 0.75 by Epoch 50, and plateaus around 0.77-0.78 from Epoch 100 onwards.
* **d = 10 (Dashed Red):** Starts at approximately 0.60 at Epoch 0, increases rapidly to around 0.75 by Epoch 50, and plateaus around 0.77-0.78 from Epoch 100 onwards.
* **d = 100 (Dashed-Dotted Red):** Starts at approximately 0.60 at Epoch 0, increases rapidly to around 0.75 by Epoch 50, and plateaus around 0.77-0.78 from Epoch 100 onwards.
* **d = 500 (Solid Blue):** Starts at approximately 0.60 at Epoch 0, increases rapidly to around 0.77 by Epoch 50, and plateaus around 0.78-0.79 from Epoch 100 onwards.
* **d = 1000 (Dashed Blue):** Starts at approximately 0.60 at Epoch 0, increases rapidly to around 0.77 by Epoch 50, and plateaus around 0.78-0.79 from Epoch 100 onwards.
* **d = 5000 (Dashed-Dotted Blue):** Starts at approximately 0.60 at Epoch 0, increases rapidly to around 0.77 by Epoch 50, and plateaus around 0.78-0.79 from Epoch 100 onwards.
**Right Chart (Testing Accuracy):**
* **d = 1 (Solid Red):** Starts at approximately 0.56 at Epoch 0, increases rapidly to around 0.61 by Epoch 20, and plateaus around 0.61-0.62 from Epoch 50 onwards.
* **d = 10 (Dashed Red):** Starts at approximately 0.56 at Epoch 0, increases rapidly to around 0.61 by Epoch 20, and plateaus around 0.61-0.62 from Epoch 50 onwards.
* **d = 100 (Dashed-Dotted Red):** Starts at approximately 0.56 at Epoch 0, increases rapidly to around 0.61 by Epoch 20, and plateaus around 0.61-0.62 from Epoch 50 onwards.
* **d = 500 (Solid Blue):** Starts at approximately 0.56 at Epoch 0, increases rapidly to around 0.62 by Epoch 20, and plateaus around 0.62-0.63 from Epoch 50 onwards.
* **d = 1000 (Dashed Blue):** Starts at approximately 0.56 at Epoch 0, increases rapidly to around 0.62 by Epoch 20, and plateaus around 0.62-0.63 from Epoch 50 onwards.
* **d = 5000 (Dashed-Dotted Blue):** Starts at approximately 0.56 at Epoch 0, increases rapidly to around 0.62 by Epoch 20, and plateaus around 0.62-0.63 from Epoch 50 onwards.
### Key Observations
* In the Training Accuracy chart, all models converge to a similar accuracy level (around 0.77-0.79) regardless of the 'd' value.
* In the Testing Accuracy chart, models with `d = 500`, `d = 1000`, and `d = 5000` achieve slightly higher testing accuracy (around 0.62-0.63) compared to those with `d = 1`, `d = 10`, and `d = 100` (around 0.61-0.62).
* Both charts show rapid initial learning (steep slope) followed by a plateau, indicating diminishing returns from further training.
* The difference in performance between different 'd' values is more pronounced in the Testing Accuracy chart than in the Training Accuracy chart.
### Interpretation
The data suggests that increasing the value of 'd' (up to 500 or 1000) improves the generalization performance of the models, as evidenced by the higher testing accuracy. However, beyond a certain point (around d=500), further increases in 'd' do not lead to significant improvements in either training or testing accuracy. This could indicate that the models are reaching a point of diminishing returns or that other factors are becoming more limiting.
The gap between training and testing accuracy suggests some degree of overfitting, particularly for the models with lower 'd' values. The models are learning the training data well, but their ability to generalize to unseen data is limited. The plateau in both charts indicates that the models have converged and further training is unlikely to yield significant improvements. The consistent performance of d=500, d=1000, and d=5000 suggests that these values represent a good balance between model complexity and generalization ability.