## Problem Formulations: Max-SAT, Number Partitioning, and Knapsack
### Overview
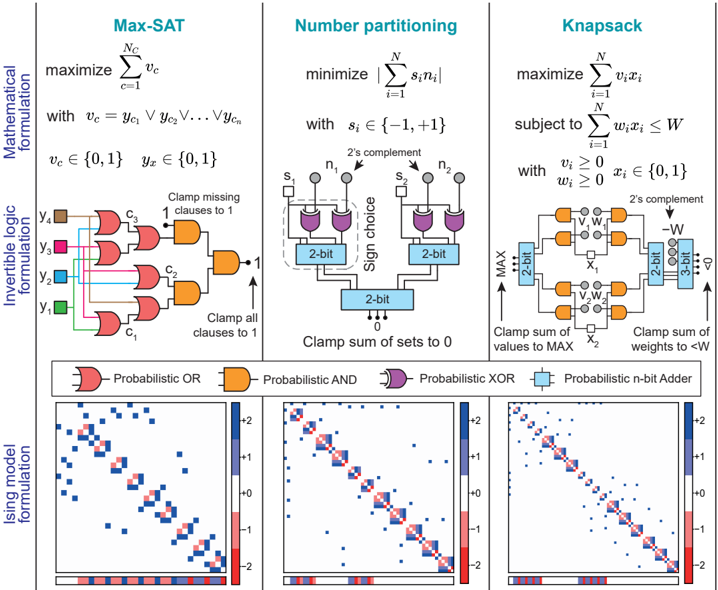
The image presents three different problem formulations: Max-SAT, Number Partitioning, and Knapsack. Each problem is described using a mathematical formulation, an invertible logic formulation, and an Ising model formulation. The image provides equations, logic diagrams, and heatmaps to represent each problem.
### Components/Axes
**General Layout:**
The image is divided into three vertical sections, one for each problem: Max-SAT (left), Number Partitioning (center), and Knapsack (right). Each section is further divided into three horizontal sections: Mathematical formulation (top), Invertible logic formulation (middle), and Ising model formulation (bottom).
**Max-SAT (Left Section):**
* **Mathematical formulation:**
* Objective: maximize ∑(from c=1 to Nc) vc
* Constraint: vc = yc1 ∨ yc2 ∨ ... ∨ ycn
* Domain: vc ∈ {0, 1}, yx ∈ {0, 1}
* **Invertible logic formulation:**
* Logic gates: Probabilistic OR (red), Probabilistic AND (orange)
* Inputs: y1 (green), y2 (cyan), y3 (magenta), y4 (brown)
* Outputs: c1, c2, c3, and a final AND gate outputting 1.
* Text: "Clamp missing 1 clauses to 1", "Clamp all clauses to 1"
* **Ising model formulation:**
* Heatmap: A square matrix with values ranging from -2 (red) to +2 (blue).
* Colorbar: Ranges from -2 (red) to +2 (blue), with intermediate values of -1, 0, and +1.
**Number Partitioning (Center Section):**
* **Mathematical formulation:**
* Objective: minimize |∑(from i=1 to N) sini|
* Constraint: si ∈ {-1, +1}
* **Invertible logic formulation:**
* Components: 2-bit adders (light blue), Probabilistic XOR (purple)
* Inputs: n1, s1, n2, s2
* Text: "2's complement", "Sign choice", "Clamp sum of sets to 0"
* **Ising model formulation:**
* Heatmap: A square matrix with values ranging from -2 (red) to +2 (blue).
* Colorbar: Ranges from -2 (red) to +2 (blue), with intermediate values of -1, 0, and +1.
**Knapsack (Right Section):**
* **Mathematical formulation:**
* Objective: maximize ∑(from i=1 to N) vixi
* Constraint: ∑(from i=1 to N) wixi ≤ W
* Domain: vi ≥ 0, wi ≥ 0, xi ∈ {0, 1}
* **Invertible logic formulation:**
* Components: 2-bit adders (light blue), Probabilistic AND (orange)
* Inputs: v1, w1, x1, v2, w2, x2
* Text: "2's complement", "Clamp sum of values to MAX", "Clamp sum of weights to <W", "-W", "MAX"
* **Ising model formulation:**
* Heatmap: A square matrix with values ranging from -2 (red) to +2 (blue).
* Colorbar: Ranges from -2 (red) to +2 (blue), with intermediate values of -1, 0, and +1.
**Legend (Bottom):**
Located at the bottom center of the image.
* Probabilistic OR: Red gate symbol
* Probabilistic AND: Orange gate symbol
* Probabilistic XOR: Purple gate symbol
* Probabilistic n-bit Adder: Light blue rectangle symbol
### Detailed Analysis or ### Content Details
**Max-SAT:**
* **Mathematical Formulation:** The goal is to maximize the sum of variables `vc`, where each `vc` is the logical OR of variables `yc1` through `ycn`. Both `vc` and `yx` are binary variables (0 or 1).
* **Invertible Logic Formulation:** The logic circuit takes four inputs (y1 to y4) and uses OR gates to compute intermediate values (c1 to c3). These intermediate values are then combined using an AND gate to produce a final output. The circuit includes clamps to ensure certain conditions are met.
* **Ising Model Formulation:** The heatmap shows a pattern, with a strong diagonal and off-diagonal elements. The diagonal elements are mostly positive (blue), while the off-diagonal elements show a mix of positive and negative (red) correlations.
**Number Partitioning:**
* **Mathematical Formulation:** The goal is to minimize the absolute value of the sum of variables `sini`, where each `si` can be either -1 or +1.
* **Invertible Logic Formulation:** The logic circuit uses XOR gates and 2-bit adders to perform the partitioning. The circuit includes a sign choice component and clamps the sum of sets to 0.
* **Ising Model Formulation:** The heatmap shows a strong diagonal pattern, with mostly positive (blue) correlations along the diagonal. There are also some off-diagonal correlations.
**Knapsack:**
* **Mathematical Formulation:** The goal is to maximize the sum of `vixi`, subject to the constraint that the sum of `wixi` is less than or equal to `W`. The variables `vi` and `wi` are non-negative, and `xi` is a binary variable (0 or 1).
* **Invertible Logic Formulation:** The logic circuit uses AND gates and adders to perform the knapsack optimization. The circuit includes components for clamping the sum of values to MAX and the sum of weights to less than W.
* **Ising Model Formulation:** The heatmap shows a diagonal pattern, with mostly positive (blue) correlations along the diagonal. There are also some off-diagonal correlations.
### Key Observations
* Each problem is represented in three different ways: mathematically, logically, and using an Ising model.
* The Ising model formulations result in heatmaps that show correlation patterns between variables.
* The logic circuits use probabilistic gates to implement the problem constraints.
### Interpretation
The image demonstrates how three different optimization problems (Max-SAT, Number Partitioning, and Knapsack) can be formulated using mathematical equations, logic circuits, and Ising models. The Ising model formulations allow these problems to be mapped onto physical systems that can potentially solve them efficiently. The heatmaps provide a visual representation of the correlations between variables in the Ising model. The logic circuits show how the problem constraints can be implemented using probabilistic gates.