\n
## Line Chart: Spearman's Rank Correlation Coefficient vs. Number of Samples
### Overview
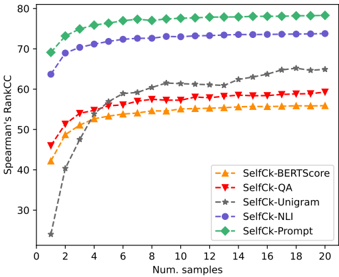
This image presents a line chart illustrating the Spearman's Rank Correlation Coefficient (CC) as a function of the number of samples used. Five different methods ("SelfCk-BERTScore", "SelfCk-QA", "SelfCk-Unigram", "SelfCk-NLI", and "SelfCk-Prompt") are compared. The chart shows how the correlation coefficient changes as the number of samples increases from 2 to 20.
### Components/Axes
* **X-axis:** "Num. samples" (Number of samples), ranging from 2 to 20, with tick marks at integer values.
* **Y-axis:** "Spearman's RankCC" (Spearman's Rank Correlation Coefficient), ranging from 30 to 80, with tick marks at intervals of 10.
* **Legend:** Located in the top-right corner, identifying each line with a color and label:
* SelfCk-BERTScore (Orange, dashed line)
* SelfCk-QA (Red, dashed line)
* SelfCk-Unigram (Gray, dashed line)
* SelfCk-NLI (Purple, dashed line)
* SelfCk-Prompt (Green, solid line)
### Detailed Analysis
Here's a breakdown of each line's trend and approximate data points, verified against the legend colors:
* **SelfCk-Prompt (Green, solid line):** This line exhibits a rapid initial increase, quickly plateauing at a high correlation coefficient.
* At Num. samples = 2: Spearman's RankCC ≈ 73
* At Num. samples = 4: Spearman's RankCC ≈ 77
* At Num. samples = 6: Spearman's RankCC ≈ 78
* At Num. samples = 8: Spearman's RankCC ≈ 79
* At Num. samples = 10: Spearman's RankCC ≈ 79
* At Num. samples = 20: Spearman's RankCC ≈ 79
* **SelfCk-NLI (Purple, dashed line):** This line shows a steep increase initially, then levels off, but remains lower than SelfCk-Prompt.
* At Num. samples = 2: Spearman's RankCC ≈ 65
* At Num. samples = 4: Spearman's RankCC ≈ 72
* At Num. samples = 6: Spearman's RankCC ≈ 74
* At Num. samples = 8: Spearman's RankCC ≈ 75
* At Num. samples = 20: Spearman's RankCC ≈ 75
* **SelfCk-Unigram (Gray, dashed line):** This line starts at a low value and increases steadily, but remains the lowest performing method.
* At Num. samples = 2: Spearman's RankCC ≈ 25
* At Num. samples = 4: Spearman's RankCC ≈ 35
* At Num. samples = 6: Spearman's RankCC ≈ 45
* At Num. samples = 8: Spearman's RankCC ≈ 52
* At Num. samples = 20: Spearman's RankCC ≈ 62
* **SelfCk-QA (Red, dashed line):** This line shows a moderate increase, plateauing around 58-60.
* At Num. samples = 2: Spearman's RankCC ≈ 43
* At Num. samples = 4: Spearman's RankCC ≈ 52
* At Num. samples = 6: Spearman's RankCC ≈ 56
* At Num. samples = 8: Spearman's RankCC ≈ 58
* At Num. samples = 20: Spearman's RankCC ≈ 58
* **SelfCk-BERTScore (Orange, dashed line):** This line exhibits a similar trend to SelfCk-QA, with a moderate increase and plateauing around 55-58.
* At Num. samples = 2: Spearman's RankCC ≈ 40
* At Num. samples = 4: Spearman's RankCC ≈ 50
* At Num. samples = 6: Spearman's RankCC ≈ 54
* At Num. samples = 8: Spearman's RankCC ≈ 56
* At Num. samples = 20: Spearman's RankCC ≈ 57
### Key Observations
* "SelfCk-Prompt" consistently achieves the highest Spearman's Rank Correlation Coefficient across all sample sizes.
* The correlation coefficients for all methods tend to plateau as the number of samples increases beyond 8.
* "SelfCk-Unigram" consistently performs the worst, with significantly lower correlation coefficients compared to the other methods.
* "SelfCk-BERTScore" and "SelfCk-QA" show similar performance, with moderate correlation coefficients.
### Interpretation
The data suggests that the "SelfCk-Prompt" method is the most effective at capturing the relationship between the samples, as indicated by its consistently high Spearman's Rank Correlation Coefficient. The plateauing effect observed for all methods indicates that increasing the number of samples beyond a certain point (around 8-10) does not significantly improve the correlation. This could be due to the inherent limitations of the data or the methods themselves. The poor performance of "SelfCk-Unigram" suggests that using unigram-based features is insufficient for accurately capturing the underlying relationships in the data. The similar performance of "SelfCk-BERTScore" and "SelfCk-QA" indicates that both methods provide comparable results, potentially leveraging different aspects of the data to achieve similar levels of correlation. The chart demonstrates the importance of method selection and sample size in achieving reliable correlation results.