## Line Graph: Spearman's Rank Correlation Coefficient (kCC) vs. Number of Samples
### Overview
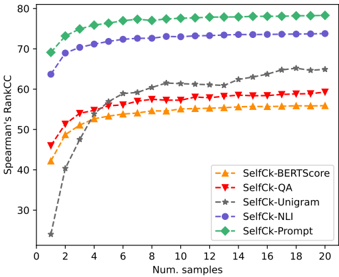
The graph illustrates the relationship between the number of training samples and Spearman's Rank Correlation Coefficient (kCC) for five different methods: SelfCk-BERTScore, SelfCk-QA, SelfCk-Unigram, SelfCk-NLI, and SelfCk-Prompt. The x-axis represents the number of samples (0–20), and the y-axis represents kCC (30–80). Each method is represented by a distinct line with unique markers and colors.
### Components/Axes
- **X-axis**: "Num. samples" (0–20, increments of 2).
- **Y-axis**: "Spearman's Rank kCC" (30–80, increments of 10).
- **Legend**: Located at the bottom-right corner, mapping colors/markers to methods:
- Orange triangles: SelfCk-BERTScore
- Red triangles: SelfCk-QA
- Gray stars: SelfCk-Unigram
- Blue circles: SelfCk-NLI
- Green diamonds: SelfCk-Prompt
### Detailed Analysis
1. **SelfCk-Prompt (Green Diamonds)**:
- Starts at ~70 kCC for 0 samples.
- Gradually increases to ~78 kCC by 20 samples.
- Shows minimal fluctuation after 6 samples.
2. **SelfCk-NLI (Blue Circles)**:
- Begins at ~65 kCC for 0 samples.
- Rises steadily to ~74 kCC by 20 samples.
- Maintains a consistent upward trend.
3. **SelfCk-QA (Red Triangles)**:
- Starts at ~45 kCC for 0 samples.
- Increases to ~58 kCC by 20 samples.
- Shows moderate growth with slight plateaus.
4. **SelfCk-Unigram (Gray Stars)**:
- Begins at ~25 kCC for 0 samples.
- Sharply rises to ~64 kCC by 20 samples.
- Exhibits the steepest slope among all methods.
5. **SelfCk-BERTScore (Orange Triangles)**:
- Starts at ~42 kCC for 0 samples.
- Reaches ~55 kCC by 20 samples.
- Shows gradual improvement with minor fluctuations.
### Key Observations
- **Highest Performance**: SelfCk-Prompt and SelfCk-NLI consistently achieve the highest kCC values, with Prompt plateauing near 78 and NLI reaching 74.
- **Most Improvement**: SelfCk-Unigram demonstrates the largest relative improvement (from 25 to 64 kCC), suggesting it benefits significantly from increased sample size.
- **Stability**: SelfCk-Prompt and SelfCk-NLI exhibit the least variability, indicating robustness across sample sizes.
- **Lower Performance**: SelfCk-BERTScore and SelfCk-QA lag behind, with BERTScore showing the slowest growth.
### Interpretation
The data suggests that **SelfCk-Prompt** and **SelfCk-NLI** are the most effective methods for maintaining high kCC values, even with limited samples. Their stability implies they are less sensitive to data quantity. In contrast, **SelfCk-Unigram** shows dramatic improvement with more samples, highlighting its dependency on larger datasets. **SelfCk-BERTScore** and **SelfCk-QA** underperform relative to others, potentially indicating limitations in their design or training approach. The trends emphasize the importance of method selection based on data availability and stability requirements.