## Line Graphs: Interleaved Performance Metrics
### Overview
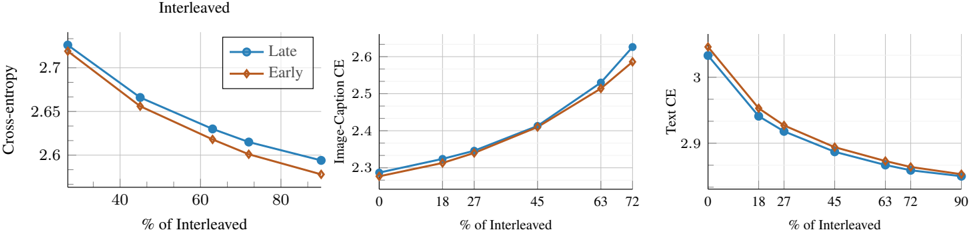
The image contains three line graphs comparing performance metrics ("Cross-entropy," "Image-Caption CE," and "Text CE") across varying percentages of "Interleaved" data. Each graph tracks two methods: "Late" (blue) and "Early" (orange). The x-axis represents the percentage of interleaved data, while the y-axis shows metric values. All graphs demonstrate trends in performance as interleaving increases.
---
### Components/Axes
1. **Graph 1: Cross-entropy**
- **X-axis**: "% of Interleaved" (40% to 80%, increments of 20%)
- **Y-axis**: Cross-entropy (2.55 to 2.75)
- **Legend**: "Late" (blue), "Early" (orange)
- **Legend Position**: Top-left corner
2. **Graph 2: Image-Caption CE**
- **X-axis**: "% of Interleaved" (0% to 72%, increments of 18%)
- **Y-axis**: Image-Caption CE (2.25 to 2.65)
- **Legend**: "Late" (blue), "Early" (orange)
- **Legend Position**: Top-left corner
3. **Graph 3: Text CE**
- **X-axis**: "% of Interleaved" (0% to 90%, increments of 18%)
- **Y-axis**: Text CE (2.8 to 3.1)
- **Legend**: "Late" (blue), "Early" (orange)
- **Legend Position**: Top-left corner
---
### Detailed Analysis
#### Graph 1: Cross-entropy
- **Trend**: Both lines slope downward as interleaving increases. "Late" consistently outperforms "Early."
- **Data Points**:
- 40%: Late ≈ 2.74, Early ≈ 2.72
- 60%: Late ≈ 2.63, Early ≈ 2.60
- 80%: Late ≈ 2.62, Early ≈ 2.58
#### Graph 2: Image-Caption CE
- **Trend**: Both lines slope upward as interleaving increases. "Late" maintains a slight edge over "Early."
- **Data Points**:
- 0%: Late ≈ 2.28, Early ≈ 2.27
- 18%: Late ≈ 2.31, Early ≈ 2.30
- 45%: Late ≈ 2.45, Early ≈ 2.43
- 72%: Late ≈ 2.65, Early ≈ 2.62
#### Graph 3: Text CE
- **Trend**: Both lines slope downward as interleaving increases. "Early" starts slightly higher but converges with "Late" at higher percentages.
- **Data Points**:
- 0%: Late ≈ 3.05, Early ≈ 3.08
- 18%: Late ≈ 2.95, Early ≈ 2.97
- 45%: Late ≈ 2.88, Early ≈ 2.89
- 72%: Late ≈ 2.85, Early ≈ 2.86
- 90%: Late ≈ 2.84, Early ≈ 2.85
---
### Key Observations
1. **Cross-entropy**: Higher interleaving reduces entropy for both methods, with "Late" always achieving lower values.
2. **Image-Caption CE**: Performance improves with interleaving, but "Late" maintains a marginal advantage.
3. **Text CE**: Both methods converge at higher interleaving percentages, suggesting diminishing returns beyond ~60%.
---
### Interpretation
- **Performance Trends**:
- "Late" consistently outperforms "Early" in Cross-entropy and Image-Caption CE, indicating better optimization for these metrics.
- In Text CE, the gap between methods narrows at higher interleaving, suggesting similar effectiveness at extreme values.
- **Interleaving Impact**:
- Increasing interleaving generally improves performance (lower entropy, higher Image-Caption CE, lower Text CE), but the benefits plateau at higher percentages.
- **Method Differences**:
- "Late" appears more robust across metrics, while "Early" shows diminishing returns in Text CE. This could reflect architectural or training differences between the methods.
- **Anomalies**:
- No significant outliers; trends are consistent across all graphs.
The data suggests that interleaving improves model performance, with the "Late" method being more effective overall. However, the convergence in Text CE at 90% interleaving implies that further gains may require alternative strategies beyond increasing interleaving.