# Technical Data Extraction: Optimizer Performance Comparison
This document contains a detailed extraction of data from a set of three line charts comparing the performance of different optimizers (AdamW, 8-Bit Adam, and Adafactor) across varying ranks against a baseline.
## 1. Global Metadata and Layout
* **Image Type:** Three-panel line chart.
* **Language:** English.
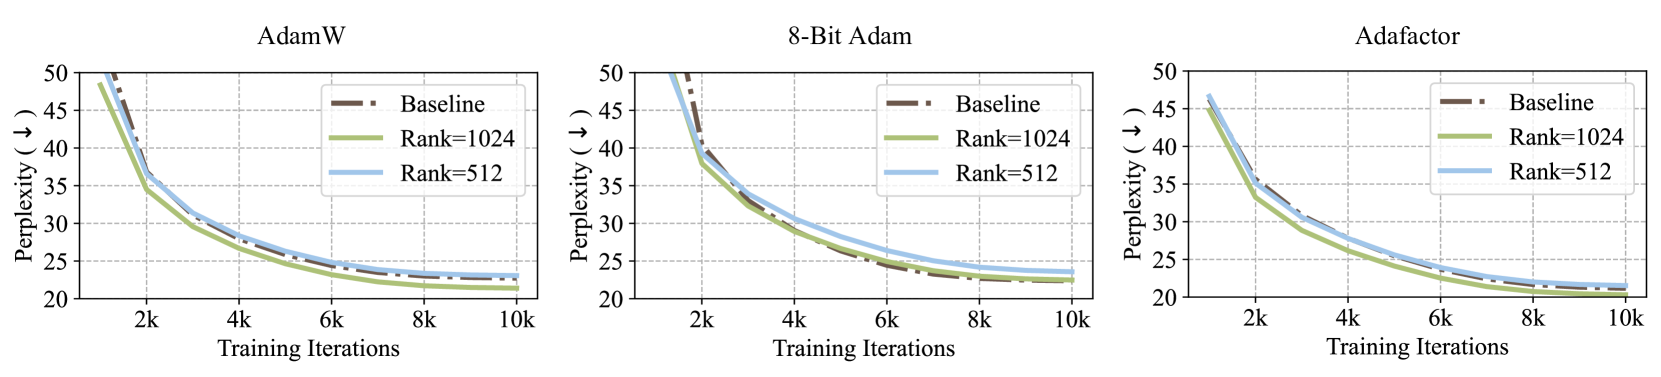
* **Common Y-Axis:** Perplexity ($\downarrow$) - Lower is better.
* **Range:** 20 to 50.
* **Markers:** 20, 25, 30, 35, 40, 45, 50.
* **Common X-Axis:** Training Iterations.
* **Range:** 0 to 10k.
* **Markers:** 2k, 4k, 6k, 8k, 10k.
* **Common Legend (Top Right of each panel):**
* **Baseline:** Dark Brown, Dash-Dot line style.
* **Rank=1024:** Light Green, Solid line style.
* **Rank=512:** Light Blue, Solid line style.
---
## 2. Panel 1: AdamW
**Header:** AdamW
### Trend Analysis
* **Baseline (Brown Dash-Dot):** Starts highest (off-chart at 1k), drops sharply, and converges to approximately 22.5 at 10k.
* **Rank=1024 (Green Solid):** Starts lower than the baseline at 1k (~48), maintains the lowest perplexity throughout the training, ending at approximately 21.
* **Rank=512 (Blue Solid):** Follows a similar curve to Rank=1024 but remains consistently higher, ending at approximately 23.
### Data Point Extraction (Approximate)
| Iterations | Baseline | Rank=1024 | Rank=512 |
| :--- | :--- | :--- | :--- |
| 2k | ~40 | ~34 | ~36 |
| 4k | ~28 | ~27 | ~28 |
| 6k | ~24 | ~23 | ~25 |
| 10k | ~22.5 | ~21 | ~23 |
---
## 3. Panel 2: 8-Bit Adam
**Header:** 8-Bit Adam
### Trend Analysis
* **Baseline (Brown Dash-Dot):** Shows a steep decline, crossing below the Rank=512 line around 3k iterations and ending as the lowest perplexity at 10k.
* **Rank=1024 (Green Solid):** Starts at ~48 at 1k, tracks very closely with the baseline after 4k iterations.
* **Rank=512 (Blue Solid):** Consistently the highest perplexity after the initial 2k iterations, ending at approximately 24.
### Data Point Extraction (Approximate)
| Iterations | Baseline | Rank=1024 | Rank=512 |
| :--- | :--- | :--- | :--- |
| 2k | ~42 | ~38 | ~40 |
| 4k | ~29 | ~29 | ~31 |
| 6k | ~25 | ~25 | ~27 |
| 10k | ~22 | ~22.5 | ~24 |
---
## 4. Panel 3: Adafactor
**Header:** Adafactor
### Trend Analysis
* **Baseline (Brown Dash-Dot):** Starts high, converges with Rank=1024 around 8k iterations, and ends slightly above it.
* **Rank=1024 (Green Solid):** Shows the most efficient reduction in perplexity, maintaining the lowest position for the majority of the timeline, ending at ~20.5.
* **Rank=512 (Blue Solid):** Tracks above Rank=1024 throughout the duration, ending at ~22.
### Data Point Extraction (Approximate)
| Iterations | Baseline | Rank=1024 | Rank=512 |
| :--- | :--- | :--- | :--- |
| 2k | ~36 | ~33 | ~36 |
| 4k | ~27 | ~26 | ~28 |
| 6k | ~23 | ~22 | ~24 |
| 10k | ~21 | ~20.5 | ~22 |
---
## 5. Summary of Findings
* **Rank Performance:** In all three optimizers, **Rank=1024** (Green) consistently outperforms **Rank=512** (Blue), achieving lower perplexity.
* **Optimizer Comparison:**
* For **AdamW** and **Adafactor**, the Rank=1024 configuration manages to beat or match the Baseline performance.
* For **8-Bit Adam**, the Baseline eventually achieves a slightly lower perplexity than the Rank-based configurations by the 10k iteration mark.
* **Convergence:** All models show rapid improvement (perplexity drop) between 0 and 4k iterations, with significant flattening of the curves occurring after 6k iterations.