## System Architecture Diagram: Kepler Agent for Symbolic Regression
### Overview
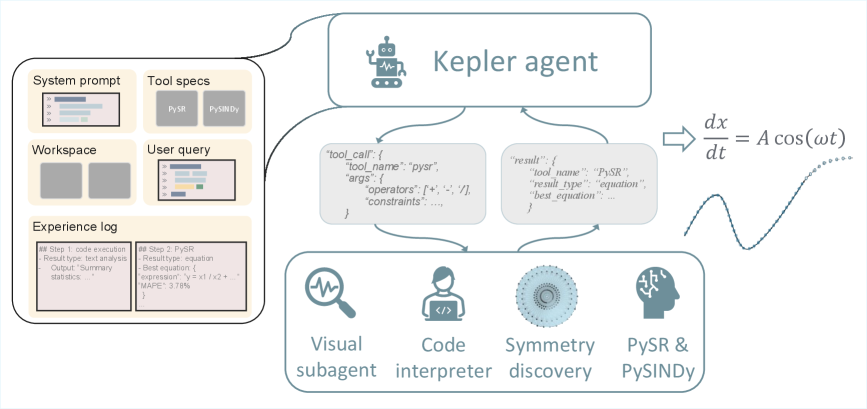
This image is a technical system architecture diagram illustrating the components and workflow of an AI agent named "Kepler agent." The agent is designed for automated scientific discovery, specifically symbolic regression—finding mathematical equations that describe data. The diagram shows the agent's internal structure, its tools, and a sample output.
### Components/Axes
The diagram is organized into three main regions:
1. **Left Panel (Agent Memory & Inputs):** A large rounded rectangle containing five sub-sections.
* **System prompt:** Depicted as a document icon with lines of text.
* **Tool specs:** Contains two labeled boxes: "PySR" and "PySINDy".
* **Workspace:** Contains two empty gray placeholder boxes.
* **User query:** Depicted as a document icon with lines of text.
* **Experience log:** Contains two detailed log entries.
* **# Step 1:** "Code execution", "Result type: text analysis", "Output: Summary statistics..."
* **# Step 2:** "PySR", "Result type: equation", "Best equation: 'y = x1 / x2 + ...'", "MAPE: 3.78%"
2. **Central Processing Core:**
* **Top:** A rounded rectangle labeled **"Kepler agent"** with a robot icon. This is the central orchestrator.
* **Middle:** Two JSON-like data blocks connected by arrows to the Kepler agent and the tools below.
* **Left Block (Tool Call):** `{"tool_call": {"tool_name": "pysr", "args": {"operators": ["+", "-", "/", ...], "constraints": "..."}}}`
* **Right Block (Result):** `{"result": {"tool_name": "PySR", "result_type": "equation", "best_equation": "..."}}`
* **Bottom:** A row of four icons representing specialized sub-components or tools.
* **Visual subagent:** Icon of a magnifying glass over a waveform.
* **Code interpreter:** Icon of a person with `</>` on their torso.
* **Symmetry discovery:** Icon of a complex geometric pattern (mandala-like).
* **PySR & PySINDy:** Icon of a human head silhouette with circuit patterns.
3. **Right Output Region:**
* **Mathematical Equation:** `dx/dt = A cos(ωt)` displayed prominently.
* **Waveform Graph:** A simple line graph showing a sinusoidal wave, visually representing the output of the differential equation above it.
### Detailed Analysis
The diagram illustrates a closed-loop workflow for scientific discovery:
1. **Input & Context:** The Kepler agent receives a **User query** and operates within the context of a **System prompt** and a **Workspace**. It has access to **Tool specs** for PySR (Python Symbolic Regression) and PySINDy (Sparse Identification of Nonlinear Dynamics).
2. **Execution & Logging:** The agent's actions are recorded in the **Experience log**. Step 1 shows initial data analysis. Step 2 shows the result of using the PySR tool, which outputs a candidate equation and its error metric (MAPE: 3.78%).
3. **Tool Invocation:** The agent formulates a `tool_call` (specifying operators and constraints) and sends it to the appropriate tool (e.g., PySR).
4. **Result Processing:** The tool returns a `result` containing the discovered `best_equation`.
5. **Specialized Sub-components:** The agent can leverage four specialized modules: a **Visual subagent** for plotting, a **Code interpreter** for execution, a module for **Symmetry discovery**, and the core **PySR & PySINDy** engines.
6. **Final Output:** The end product of this process is a parsimonious mathematical model, exemplified by the differential equation `dx/dt = A cos(ωt)` and its corresponding waveform.
### Key Observations
* **Hybrid AI Architecture:** The system combines a central reasoning agent (Kepler) with specialized, possibly neuro-symbolic, tools (PySR, PySINDy) and subagents.
* **Iterative Learning:** The **Experience log** indicates the agent maintains a history of its steps, results, and performance metrics (like MAPE), suggesting capability for iterative refinement.
* **Multi-Modal Output:** The system produces both symbolic (the equation) and visual (the graph) representations of its findings.
* **Constraint-Driven Search:** The `tool_call` includes `operators` and `constraints`, showing the search for equations is guided and not purely random.
### Interpretation
This diagram depicts a sophisticated framework for **automated scientific model discovery**. The Kepler agent acts as an orchestrator that:
1. Understands a user's scientific question (query).
2. Selects and commands appropriate symbolic regression tools.
3. Interprets the results, logs the experience, and likely refines its approach.
4. Outputs human-interpretable mathematical laws (like the provided cosine differential equation) that describe patterns in data.
The inclusion of "Symmetry discovery" and "Visual subagent" modules suggests the system is designed not just to find equations, but to uncover underlying physical principles and present them intuitively. The workflow embodies a Peircean abductive reasoning process: starting from an observation (data in the query), it generates a hypothesis (the best_equation) that best explains the data, with the MAPE serving as a measure of explanatory power. The entire system aims to accelerate scientific insight by automating the labor-intensive task of mathematical model formulation.