## Diagram: Client Data Retention
### Overview
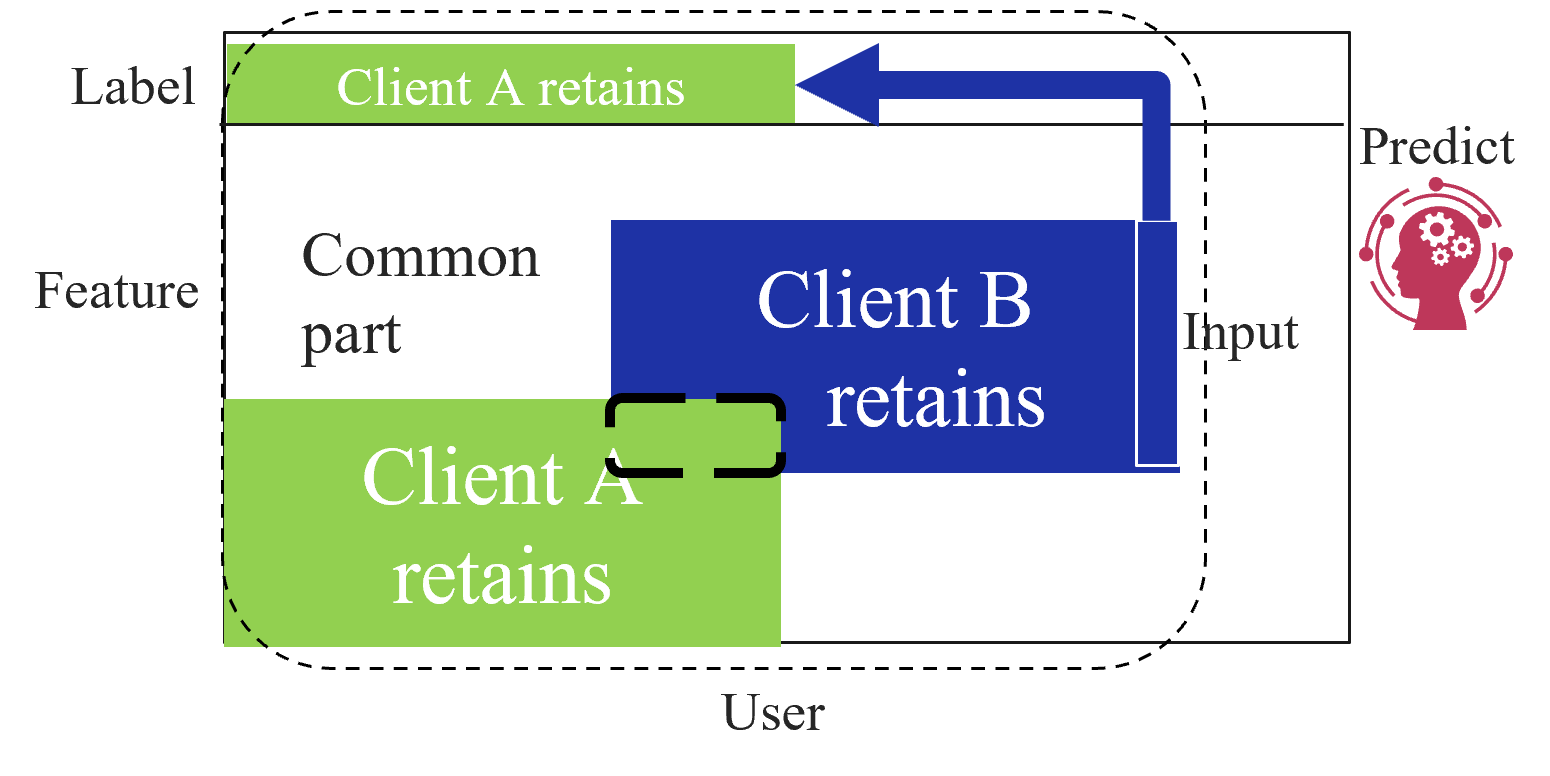
The image is a diagram illustrating how data is retained by different clients (Client A and Client B) and used for prediction. It shows the flow of data from the user, through a common feature part, and how each client retains specific portions of the data. The retained data is then used as input for a prediction model.
### Components/Axes
* **Labels:**
* Label (top-left)
* Feature (left)
* User (bottom)
* Input (right, slightly below center)
* Predict (top-right)
* **Data Blocks:**
* Client A retains (green block, top and bottom)
* Client B retains (blue block, center-right)
* Common part (white space between the green blocks)
* **Flow:** A blue arrow indicates the flow of data from "Client A retains" (top) to "Client B retains".
* **Predict Icon:** A red icon depicting a head with gears inside, representing the prediction process.
* **Outline:** A dashed line outlines the entire data flow process.
### Detailed Analysis
* **Client A retains (Top):** A green block labeled "Client A retains" is positioned at the top of the diagram, under the "Label" axis.
* **Common part:** The space between the two green blocks is labeled "Common part" under the "Feature" axis.
* **Client A retains (Bottom):** A green block labeled "Client A retains" is positioned at the bottom of the diagram, above the "User" axis.
* **Client B retains:** A blue block labeled "Client B retains" is positioned in the center-right of the diagram, partially overlapping the "Common part" and the bottom "Client A retains" block.
* **Data Flow:** A thick blue arrow originates from the top "Client A retains" block and points towards the "Client B retains" block, indicating the flow of data.
* **Input/Predict:** The "Client B retains" block is connected to the "Input" label, which leads to the "Predict" icon.
### Key Observations
* Client A retains data at both the label and user levels.
* Client B retains data that is influenced by the data retained by Client A.
* There is a "Common part" feature, suggesting shared data or processing.
* The retained data serves as input for a prediction model.
### Interpretation
The diagram illustrates a data retention and prediction process where Client A and Client B retain different parts of the data. Client A retains data related to labels and user information, while Client B retains data that is influenced by Client A's retained data. The "Common part" suggests a shared feature or processing step. The data retained by both clients is then used as input for a prediction model. This setup could represent a scenario where different clients have access to different aspects of the data, and their combined data is used for making predictions. The dashed line encompassing the entire process suggests a defined boundary or scope for the data flow.