## Diagram: Client Data Flow and Prediction System
### Overview
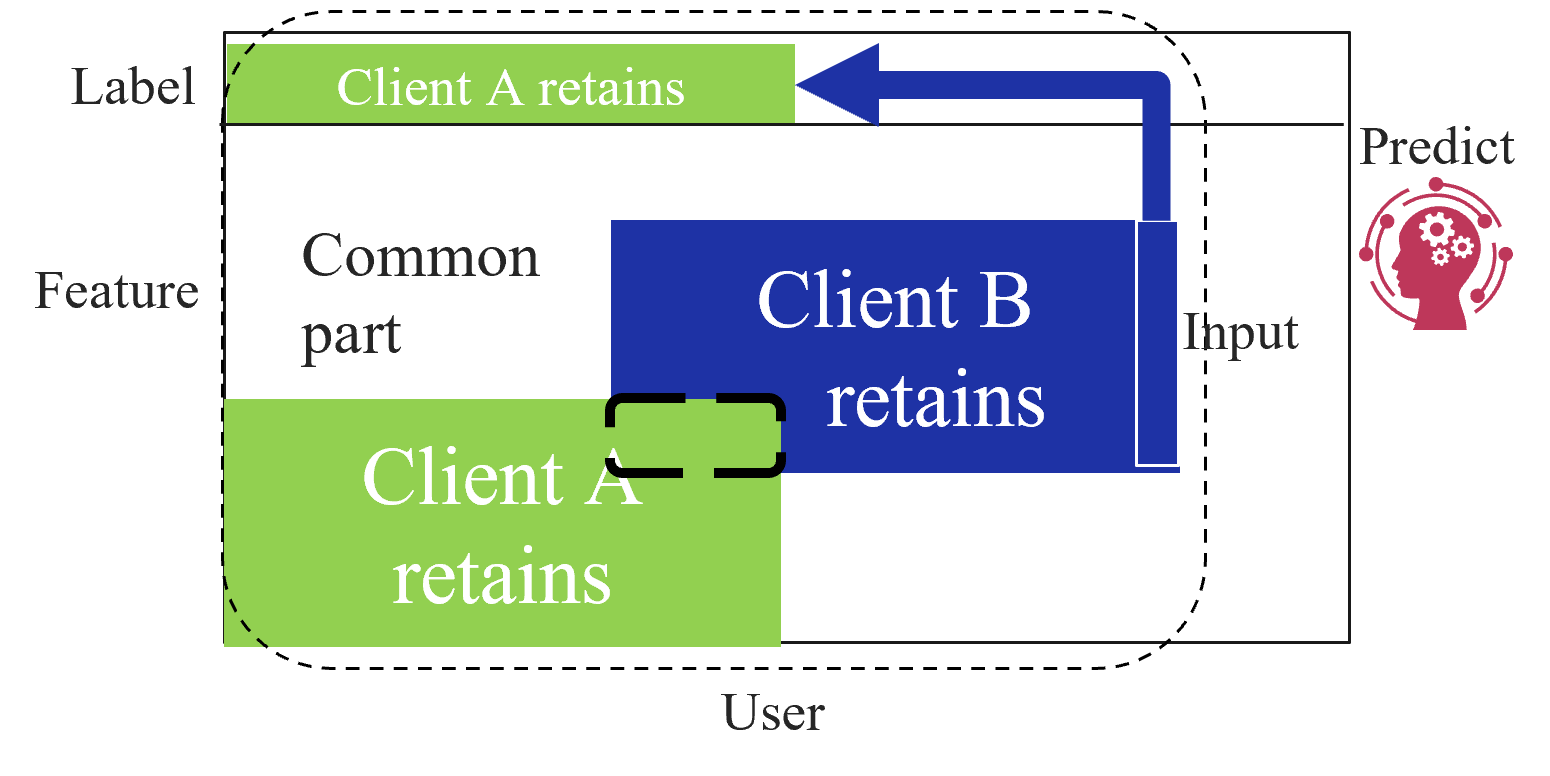
The diagram illustrates a data flow system involving two clients (A and B), a shared feature space, and a prediction mechanism. It uses color-coded sections to differentiate client-specific data retention and a common processing area, culminating in a predictive output represented by a brain icon.
### Components/Axes
1. **Main Structure**:
- A large dashed rectangle labeled "User" contains three vertical sections:
- **Top**: "Label" section with a green sub-section "Client A retains"
- **Middle**: "Common part" shared by both clients
- **Bottom**: "Client A retains" (green) and "Client B retains" (blue) overlapping the common part
- A blue arrow connects "Client A retains" to "Client B retains" via the common part
- A vertical "Input" section on the right side of the diagram
- A "Predict" section with a brain icon (gears and neural network motifs) outside the main rectangle
2. **Color Coding**:
- Green: Client A-specific data
- Blue: Client B-specific data
- Gray: Common/shared features
3. **Flow Direction**:
- Left-to-right progression from "Label" → "Common part" → "Client B retains" → "Input" → "Predict"
### Detailed Analysis
1. **Data Segmentation**:
- Client A's data is split into:
- 60% retained exclusively by Client A (green section)
- 40% shared in the common part (gray)
- Client B's data is split into:
- 70% retained exclusively by Client B (blue section)
- 30% shared in the common part (gray)
2. **Processing Flow**:
- Client A's retained data (60%) directly feeds into the common processing area
- Client B's retained data (70%) merges with Client A's data in the common part
- The combined data (common part + Client B retains) flows into the "Input" section
- The "Input" section connects to the "Predict" output via a blue arrow
3. **Predictive Component**:
- The brain icon contains three gear-like elements, suggesting:
- Feature engineering (gears)
- Model training (brain)
- Prediction execution (circular flow)
### Key Observations
1. Client A and B share 30% of their data in the common part despite different retention percentages
2. The predictive system receives input from both clients' retained data and the common part
3. The brain icon's circular flow implies iterative processing or feedback loops
4. No explicit numerical values are provided for data proportions
### Interpretation
This diagram represents a hybrid machine learning architecture where:
1. **Client-Specific Data** (60% A, 70% B) is maintained separately
2. **Shared Features** (30% overlap) enable cross-client learning
3. The predictive system combines both client-specific and shared data for output
4. The brain icon suggests the use of neural networks or cognitive computing for prediction
The system appears designed for federated learning or collaborative filtering scenarios where:
- Client privacy is maintained through data segmentation
- Shared features enable generalization across clients
- Predictive power comes from both individual and collective data patterns
The absence of explicit numerical values suggests this is a conceptual architecture rather than a specific implementation with measured performance metrics.