## Line Charts: Error Analysis with Varying σ₂
### Overview
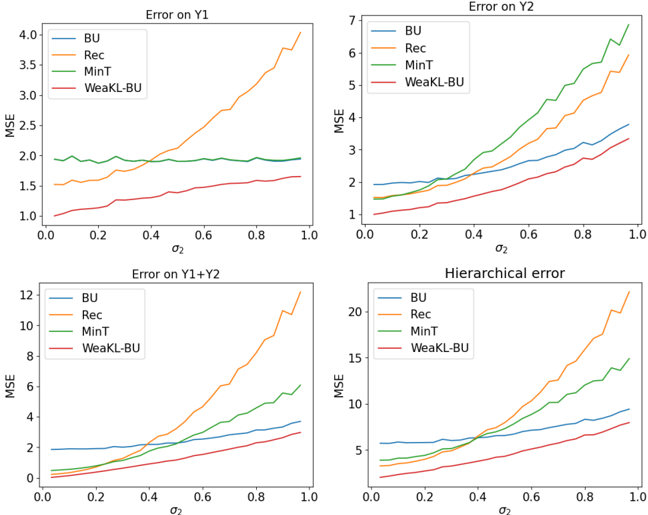
The image presents four line charts, each depicting the Mean Squared Error (MSE) as a function of σ₂ (sigma 2). The charts compare the performance of four different methods: BU, Rec, MinT, and WeakKL-BU, across different error metrics. The charts are arranged in a 2x2 grid.
### Components/Axes
Each chart shares the following components:
* **X-axis:** Labeled "σ₂", ranging from 0.0 to 1.0 with markers at 0.0, 0.2, 0.4, 0.6, 0.8, and 1.0.
* **Y-axis:** Labeled "MSE", ranging from 0 to approximately 20, with markers at 0, 2, 4, 6, 8, 10, 12, 14, 16, 18, and 20.
* **Legend:** Located in the top-left corner of each chart, identifying the four methods with corresponding colors:
* BU (Blue)
* Rec (Orange)
* MinT (Green)
* WeakKL-BU (Red)
* **Titles:** Each chart has a title indicating the error metric being evaluated:
* "Error on Y1" (Top-left)
* "Error on Y2" (Top-right)
* "Error on Y1+Y2" (Bottom-left)
* "Hierarchical error" (Bottom-right)
### Detailed Analysis or Content Details
**Chart 1: Error on Y1**
* **BU (Blue):** The line is relatively flat initially, around MSE = 1.8, then slopes upward, reaching approximately MSE = 3.8 at σ₂ = 1.0.
* **Rec (Orange):** The line starts at approximately MSE = 1.5 and increases steadily, reaching approximately MSE = 4.0 at σ₂ = 1.0.
* **MinT (Green):** The line starts at approximately MSE = 1.2 and increases gradually, reaching approximately MSE = 2.5 at σ₂ = 1.0.
* **WeakKL-BU (Red):** The line starts at approximately MSE = 1.1 and increases steadily, reaching approximately MSE = 3.0 at σ₂ = 1.0.
**Chart 2: Error on Y2**
* **BU (Blue):** The line starts at approximately MSE = 1.2 and increases steadily, reaching approximately MSE = 6.5 at σ₂ = 1.0.
* **Rec (Orange):** The line starts at approximately MSE = 1.1 and increases rapidly, reaching approximately MSE = 7.0 at σ₂ = 1.0.
* **MinT (Green):** The line starts at approximately MSE = 1.0 and increases gradually, reaching approximately MSE = 3.0 at σ₂ = 1.0.
* **WeakKL-BU (Red):** The line starts at approximately MSE = 1.0 and increases steadily, reaching approximately MSE = 5.0 at σ₂ = 1.0.
**Chart 3: Error on Y1+Y2**
* **BU (Blue):** The line starts at approximately MSE = 1.5 and increases steadily, reaching approximately MSE = 10.0 at σ₂ = 1.0.
* **Rec (Orange):** The line starts at approximately MSE = 1.3 and increases rapidly, reaching approximately MSE = 12.0 at σ₂ = 1.0.
* **MinT (Green):** The line starts at approximately MSE = 1.1 and increases gradually, reaching approximately MSE = 4.5 at σ₂ = 1.0.
* **WeakKL-BU (Red):** The line starts at approximately MSE = 1.0 and increases steadily, reaching approximately MSE = 7.0 at σ₂ = 1.0.
**Chart 4: Hierarchical error**
* **BU (Blue):** The line starts at approximately MSE = 1.0 and increases steadily, reaching approximately MSE = 18.0 at σ₂ = 1.0.
* **Rec (Orange):** The line starts at approximately MSE = 1.0 and increases rapidly, reaching approximately MSE = 20.0 at σ₂ = 1.0.
* **MinT (Green):** The line starts at approximately MSE = 1.0 and increases gradually, reaching approximately MSE = 5.0 at σ₂ = 1.0.
* **WeakKL-BU (Red):** The line starts at approximately MSE = 1.0 and increases steadily, reaching approximately MSE = 8.0 at σ₂ = 1.0.
### Key Observations
* Across all charts, the "Rec" method consistently exhibits the highest MSE values, especially as σ₂ increases.
* The "MinT" method generally demonstrates the lowest MSE values across all charts.
* The "BU" and "WeakKL-BU" methods perform similarly, with "WeakKL-BU" often slightly outperforming "BU".
* The rate of MSE increase with σ₂ varies across methods and error metrics. The "Rec" method shows the most rapid increase.
* The MSE values generally increase as σ₂ increases, indicating that the methods become less accurate as the variance increases.
### Interpretation
The charts demonstrate the performance of four different methods for estimating or predicting values (Y1, Y2, Y1+Y2, and a hierarchical error). The parameter σ₂ likely represents a level of noise or uncertainty in the data. The results suggest that the "MinT" method is the most robust to increasing noise levels (σ₂), consistently achieving the lowest MSE across all error metrics. The "Rec" method is the most sensitive to noise, exhibiting the highest MSE values. The "BU" and "WeakKL-BU" methods offer intermediate performance.
The increasing MSE values with increasing σ₂ indicate that all methods become less accurate as the uncertainty in the data grows. This is expected, as higher noise levels make it more difficult to accurately estimate the underlying values. The hierarchical error chart suggests that the methods' performance degrades more significantly when considering the combined error across multiple levels or components.
The differences in performance between the methods likely stem from their underlying assumptions and approaches to handling uncertainty. The "MinT" method may incorporate a more effective regularization or noise reduction technique, while the "Rec" method may be more susceptible to overfitting or being misled by noisy data. Further investigation into the specific algorithms used by each method would be needed to fully understand these differences.