\n
## Line Chart: Corpus Token Count vs. Overall Accuracy
### Overview
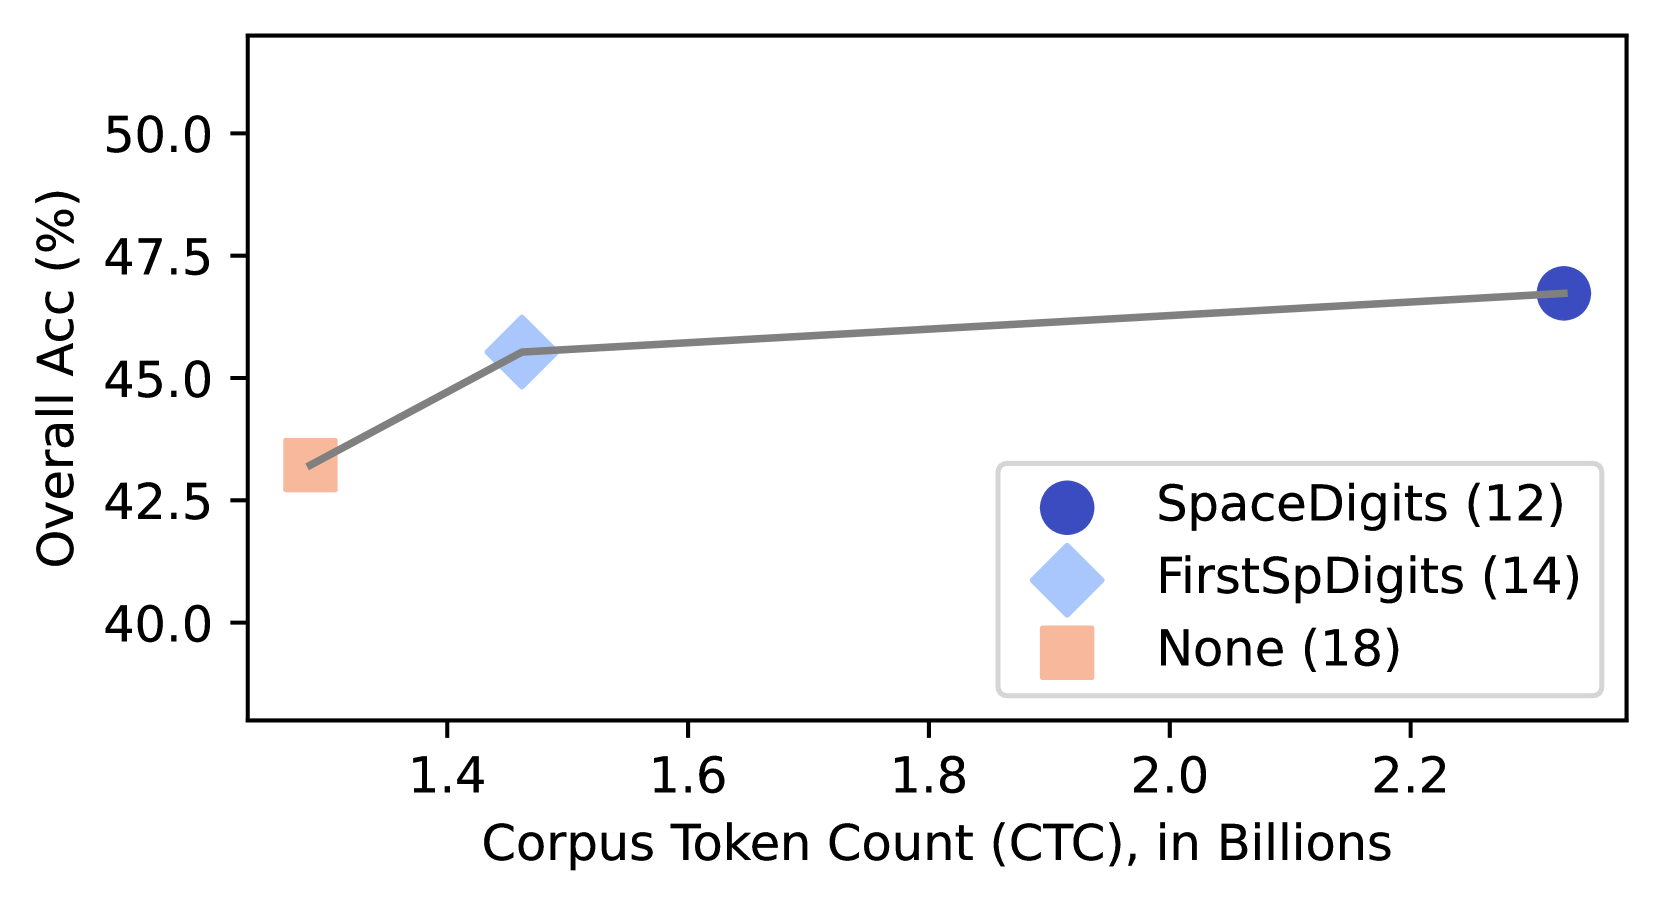
This is a line chart plotting the relationship between the size of a training corpus (in billions of tokens) and the resulting overall accuracy percentage for three different methods or models. The chart shows a positive correlation: as the Corpus Token Count (CTC) increases, the Overall Accuracy generally increases.
### Components/Axes
* **X-Axis (Horizontal):**
* **Label:** "Corpus Token Count (CTC), in Billions"
* **Scale:** Linear scale.
* **Major Tick Marks:** 1.4, 1.6, 1.8, 2.0, 2.2.
* **Range:** Approximately 1.3 to 2.35 billion tokens.
* **Y-Axis (Vertical):**
* **Label:** "Overall Acc (%)"
* **Scale:** Linear scale.
* **Major Tick Marks:** 40.0, 42.5, 45.0, 47.5, 50.0.
* **Range:** 40.0% to 50.0%.
* **Legend (Bottom-Right Corner):**
* **Position:** Located in the bottom-right quadrant of the chart area.
* **Entries:**
1. **Dark Blue Circle:** "SpaceDigits (12)"
2. **Light Blue Diamond:** "FirstSpDigits (14)"
3. **Light Orange Square:** "None (18)"
* **Note:** The numbers in parentheses (12, 14, 18) are part of the legend labels but their specific meaning (e.g., model size, parameter count) is not defined in the chart.
### Detailed Analysis
The chart contains three distinct data points connected by a single grey line, indicating they belong to the same series or experimental progression.
1. **Data Point 1 (Light Orange Square - "None (18)"):**
* **Spatial Position:** Leftmost point.
* **X-Value (CTC):** Approximately 1.3 billion tokens.
* **Y-Value (Accuracy):** Approximately 43.0%.
* **Trend Context:** This is the lowest accuracy point, corresponding to the smallest corpus size.
2. **Data Point 2 (Light Blue Diamond - "FirstSpDigits (14)"):**
* **Spatial Position:** Center-left.
* **X-Value (CTC):** Approximately 1.45 billion tokens.
* **Y-Value (Accuracy):** Approximately 45.5%.
* **Trend Context:** A significant increase in accuracy (~2.5 percentage points) is observed with a relatively small increase in corpus size (~0.15 billion tokens) from the first point.
3. **Data Point 3 (Dark Blue Circle - "SpaceDigits (12)"):**
* **Spatial Position:** Rightmost point.
* **X-Value (CTC):** Approximately 2.3 billion tokens.
* **Y-Value (Accuracy):** Approximately 46.8%.
* **Trend Context:** This point represents the highest accuracy and the largest corpus size. The slope of the line between the second and third points is less steep than between the first and second, suggesting diminishing returns.
**Trend Verification:** The connecting line slopes upward from left to right, confirming a positive trend between CTC and Accuracy. The steepest slope occurs between the "None" and "FirstSpDigits" points.
### Key Observations
* **Positive Correlation:** There is a clear, monotonic increase in Overall Accuracy as the Corpus Token Count increases across the three data points.
* **Diminishing Returns:** The gain in accuracy per additional billion tokens appears to decrease. Moving from ~1.3B to ~1.45B tokens yields a ~2.5% accuracy gain, while moving from ~1.45B to ~2.3B tokens (a much larger increase of ~0.85B tokens) yields only a ~1.3% gain.
* **Method/Model Identification:** The legend links specific accuracy/CTC combinations to named methods ("None", "FirstSpDigits", "SpaceDigits") and an associated number in parentheses. The "SpaceDigits (12)" method achieves the highest accuracy but requires a corpus more than 50% larger than the "FirstSpDigits (14)" method for a modest performance improvement.
### Interpretation
The data suggests that increasing the volume of training data (Corpus Token Count) is an effective strategy for improving the overall accuracy of the system or model being tested. However, the relationship is not linear; the most significant efficiency gains (accuracy per token) are achieved at lower corpus sizes.
The named methods in the legend likely represent different data preprocessing, augmentation, or model architecture techniques. The chart implies a trade-off: the "SpaceDigits" method, while achieving peak performance, is less data-efficient than "FirstSpDigits." The number in parentheses could indicate a model size (e.g., 12B parameters vs. 14B), suggesting that a smaller model ("SpaceDigits (12)") trained on vastly more data can outperform a larger model ("FirstSpDigits (14)") trained on less data. This highlights a critical consideration in machine learning: the balance between model capacity and data scale. The "None" baseline performs worst, establishing the value of the applied techniques.