\n
## Bar Charts: Performance Metrics Comparison
### Overview
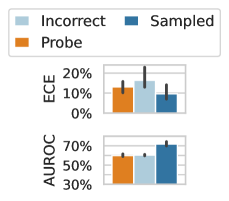
The image presents two bar charts comparing performance metrics across three conditions: "Probe", "Incorrect", and "Sampled". The metrics being compared are "ECE" (Expected Calibration Error) and "AUROC" (Area Under the Receiver Operating Characteristic curve). Each bar represents the mean value of the metric for a given condition, with error bars indicating the variability.
### Components/Axes
* **Legend:** Located at the top-center of the image.
* Light Blue: "Incorrect"
* Dark Blue: "Sampled"
* Orange: "Probe"
* **Y-axis (Top Chart):** "ECE" (Expected Calibration Error), ranging from 0% to 20%.
* **Y-axis (Bottom Chart):** "AUROC" (Area Under the Receiver Operating Characteristic curve), ranging from 30% to 70%.
* **X-axis (Both Charts):** Categories: "Probe", "Incorrect", "Sampled".
* **Error Bars:** Black vertical lines extending from the top of each bar, representing the standard error or confidence interval.
### Detailed Analysis or Content Details
**Top Chart: ECE**
* **Probe (Orange):** The bar is approximately at 11%. The error bar extends from roughly 8% to 14%.
* **Incorrect (Light Blue):** The bar is approximately at 13%. The error bar extends from roughly 10% to 16%.
* **Sampled (Dark Blue):** The bar is approximately at 9%. The error bar extends from roughly 6% to 12%.
**Bottom Chart: AUROC**
* **Probe (Orange):** The bar is approximately at 62%. The error bar extends from roughly 58% to 66%.
* **Incorrect (Light Blue):** The bar is approximately at 57%. The error bar extends from roughly 53% to 61%.
* **Sampled (Dark Blue):** The bar is approximately at 68%. The error bar extends from roughly 64% to 72%.
### Key Observations
* For ECE, the "Incorrect" condition has the highest mean value, while the "Sampled" condition has the lowest. The "Probe" condition falls in between.
* For AUROC, the "Sampled" condition has the highest mean value, while the "Incorrect" condition has the lowest. The "Probe" condition falls in between.
* The error bars suggest that the differences between the conditions for ECE are not statistically significant, as they overlap considerably. The error bars for AUROC show less overlap, suggesting potentially significant differences.
### Interpretation
The data suggests that the "Sampled" condition performs best in terms of discrimination (AUROC), but may have a higher calibration error (ECE) compared to the other conditions. The "Incorrect" condition performs worst in terms of discrimination and has a relatively high calibration error. The "Probe" condition represents a middle ground between the two.
The higher AUROC for "Sampled" indicates that it is better at distinguishing between true positives and false positives. The higher ECE for "Incorrect" suggests that the confidence scores produced by this condition are less well-calibrated, meaning that a prediction with a confidence of 80% is not actually correct 80% of the time.
The overlapping error bars for ECE suggest that the observed differences may be due to random chance. Further statistical analysis would be needed to confirm whether these differences are statistically significant. The data implies a trade-off between calibration and discrimination, where improving one may come at the expense of the other.