## Chart: Receiver Operating Characteristic (ROC) Curves
### Overview
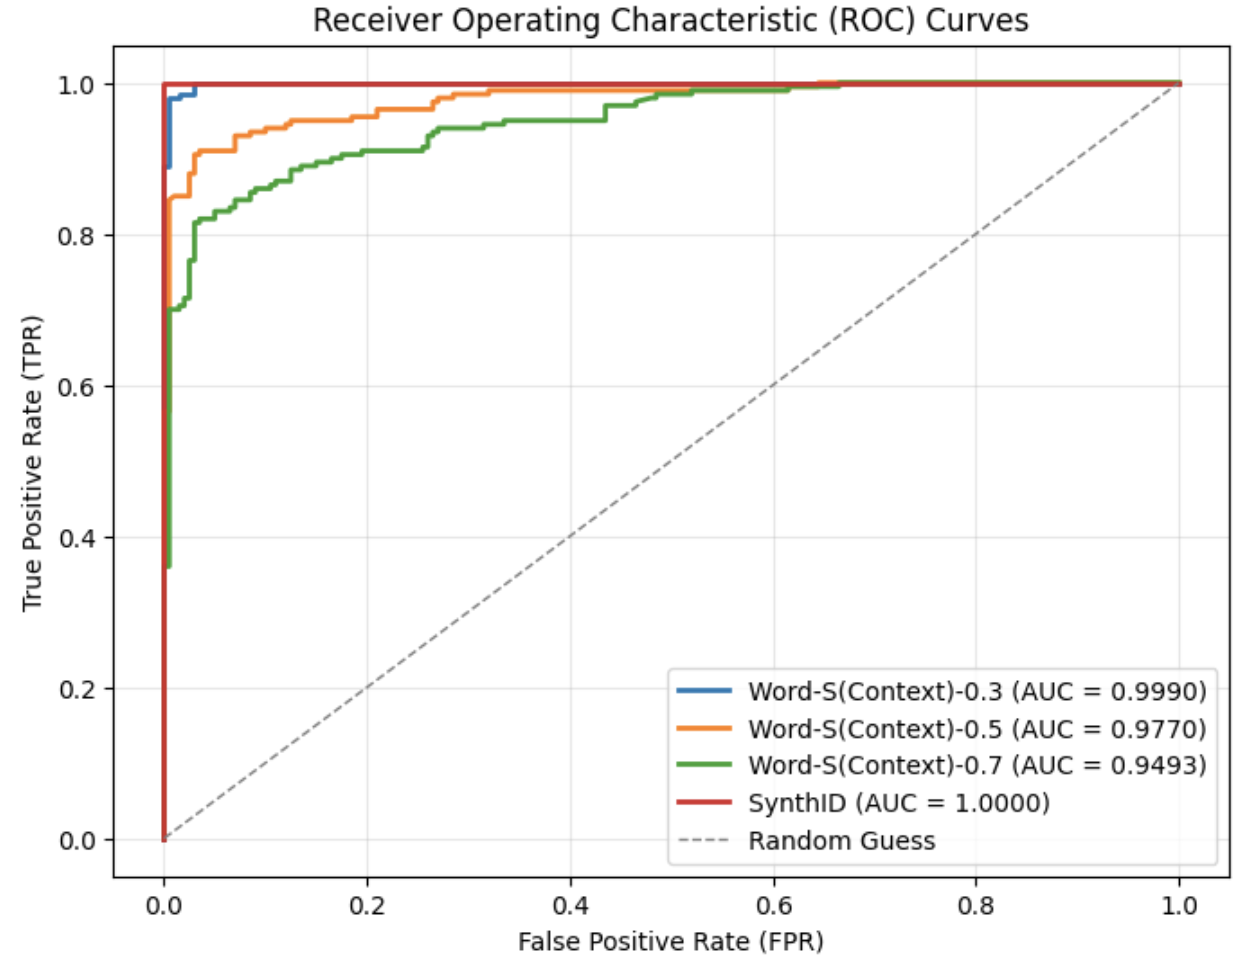
The image presents Receiver Operating Characteristic (ROC) curves for four different models: Word-S(Context)-0.3, Word-S(Context)-0.5, Word-S(Context)-0.7, and SynthID. The curves plot True Positive Rate (TPR) against False Positive Rate (FPR), and are used to evaluate the performance of binary classification models. A diagonal dashed line represents a random guess. The Area Under the Curve (AUC) is provided for each model, indicating its overall performance.
### Components/Axes
* **Title:** Receiver Operating Characteristic (ROC) Curves
* **X-axis:** False Positive Rate (FPR) - Scale: 0.0 to 1.0
* **Y-axis:** True Positive Rate (TPR) - Scale: 0.0 to 1.0
* **Legend:** Located in the bottom-right corner. Contains the following entries:
* Blue Solid Line: Word-S(Context)-0.3 (AUC = 0.9990)
* Orange Solid Line: Word-S(Context)-0.5 (AUC = 0.9770)
* Green Solid Line: Word-S(Context)-0.7 (AUC = 0.9493)
* Red Solid Line: SynthID (AUC = 1.0000)
* Gray Dashed Line: Random Guess
### Detailed Analysis
* **Random Guess (Gray Dashed Line):** This line represents the performance of a classifier that randomly guesses the class label. It slopes diagonally from (0.0, 0.0) to (1.0, 1.0).
* **Word-S(Context)-0.3 (Blue Line):** This line starts at approximately (0.0, 0.0) and quickly rises to a TPR of nearly 1.0 at an FPR of approximately 0.1. It remains at a TPR close to 1.0 for the remainder of the FPR range. The AUC is 0.9990.
* **Word-S(Context)-0.5 (Orange Line):** This line starts at approximately (0.0, 0.0) and rises to a TPR of nearly 1.0 at an FPR of approximately 0.2. It remains at a TPR close to 1.0 for the remainder of the FPR range. The AUC is 0.9770.
* **Word-S(Context)-0.7 (Green Line):** This line starts at approximately (0.0, 0.0) and rises to a TPR of nearly 1.0 at an FPR of approximately 0.3. It remains at a TPR close to 1.0 for the remainder of the FPR range. The AUC is 0.9493.
* **SynthID (Red Line):** This line starts at approximately (0.0, 0.0) and immediately rises vertically to a TPR of 1.0, remaining at this level for all FPR values. The AUC is 1.0000.
### Key Observations
* The SynthID model exhibits perfect classification performance (AUC = 1.0000).
* The Word-S(Context) models demonstrate good performance, with AUC values decreasing as the context value increases (0.9990, 0.9770, 0.9493).
* All models perform significantly better than random guessing.
* The curves show that increasing the context value in the Word-S(Context) models leads to a trade-off between sensitivity and specificity, resulting in a lower AUC.
### Interpretation
The ROC curves demonstrate the ability of each model to distinguish between positive and negative classes. The AUC value provides a single metric to quantify this ability, with higher values indicating better performance. The SynthID model achieves perfect separation, suggesting it is highly effective at classifying the data. The Word-S(Context) models show a decreasing performance with increasing context, potentially indicating that the added context introduces noise or irrelevant information that hinders the classification process. The curves visually represent the trade-off between TPR and FPR, allowing for a comprehensive evaluation of each model's performance across different classification thresholds. The fact that all curves are above the random guess line indicates that all models are performing better than chance. The steepness of the curves also indicates how quickly the models can achieve a high TPR while maintaining a low FPR.